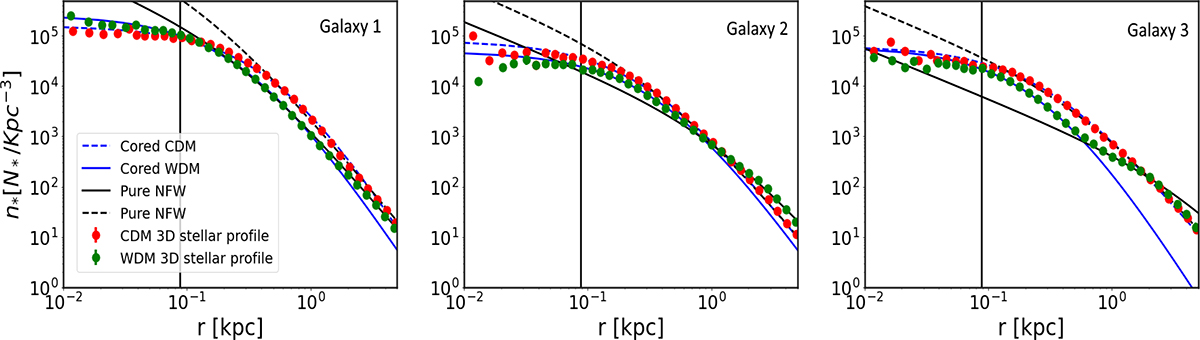
Fig. 4.
Download original image
“WDM” vs. CDM extracted stellar profiles from Mocz et al. (2019, 2020) simulation data (z = 2.23). We zoom in on the interior part of the Galaxy. In this case, there is not a significant discrepancy between the two models in the inner region, indicating that CDM profiles need to be described by the presence of a core, as for “WDM”, even if it contradicts expectations for CDM–“WDM”. However, a noticeable difference becomes apparent near the theoretical ψDM transition point in all three profiles, where the presence of a transition point similar to that expected for the ψDM profiles is easily identifiable, particularly in the case of G3. This is particularly interesting as “WDM” does not have a dark matter core-halo structure as ψDM does. Specifically the solitonic cored profile. The vertical black line represents the comoving resolution limit of the data, indicating that values smaller than this limit should be treated with caution due to their potentially unreliable nature. This is why we did not take them into account for the fitting.
Current usage metrics show cumulative count of Article Views (full-text article views including HTML views, PDF and ePub downloads, according to the available data) and Abstracts Views on Vision4Press platform.
Data correspond to usage on the plateform after 2015. The current usage metrics is available 48-96 hours after online publication and is updated daily on week days.
Initial download of the metrics may take a while.