Fig. 3.
Download original image
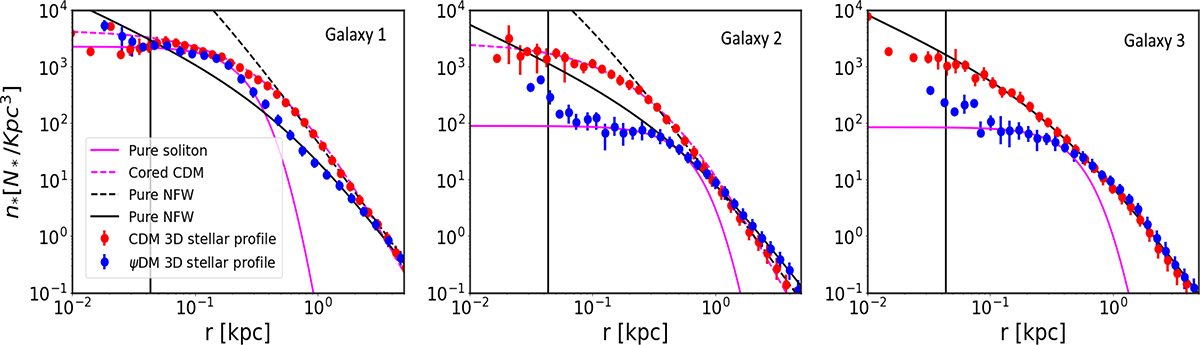
ψDM vs. CDM extracted stellar profiles from Mocz et al. (2019, 2020) simulation data (z = 5.56). This figure presents the extracted stellar profiles of the ψDM and CDM Galaxies from the simulation data of Mocz et al. (2019, 2020) at z = 5.56. We zoom in on the inner part of the galaxy using 0.01 kpc binning. We fitted ψDM profiles with a pure soliton–isothermal (magenta solid line) and NFW (black solid line) profiles to highlight the differences between the core and the outer interference pattern. The combination of these profiles is crucial for detecting a potential core-halo structure. This is evident in the case of Galaxy one, where both profiles (soliton and NFW) intersect, while still providing a good fit for the entire profile in the ψDM scenario. Meanwhile, for CDM, there is no such two-regime structure necessity, where the entire profile can be described with a single NFW profile or an isothermal profile used to describe cored CDM profiles (dashed black and magenta lines, except for Galaxy 3 where the same NFW profile can be used to describe both DM models). The vertical black line represents the comoving resolution limit of the data, indicating that values smaller than this limit should be treated with caution due to their potentially unreliable nature, and is why we did not take them into account for the fitting.
Current usage metrics show cumulative count of Article Views (full-text article views including HTML views, PDF and ePub downloads, according to the available data) and Abstracts Views on Vision4Press platform.
Data correspond to usage on the plateform after 2015. The current usage metrics is available 48-96 hours after online publication and is updated daily on week days.
Initial download of the metrics may take a while.