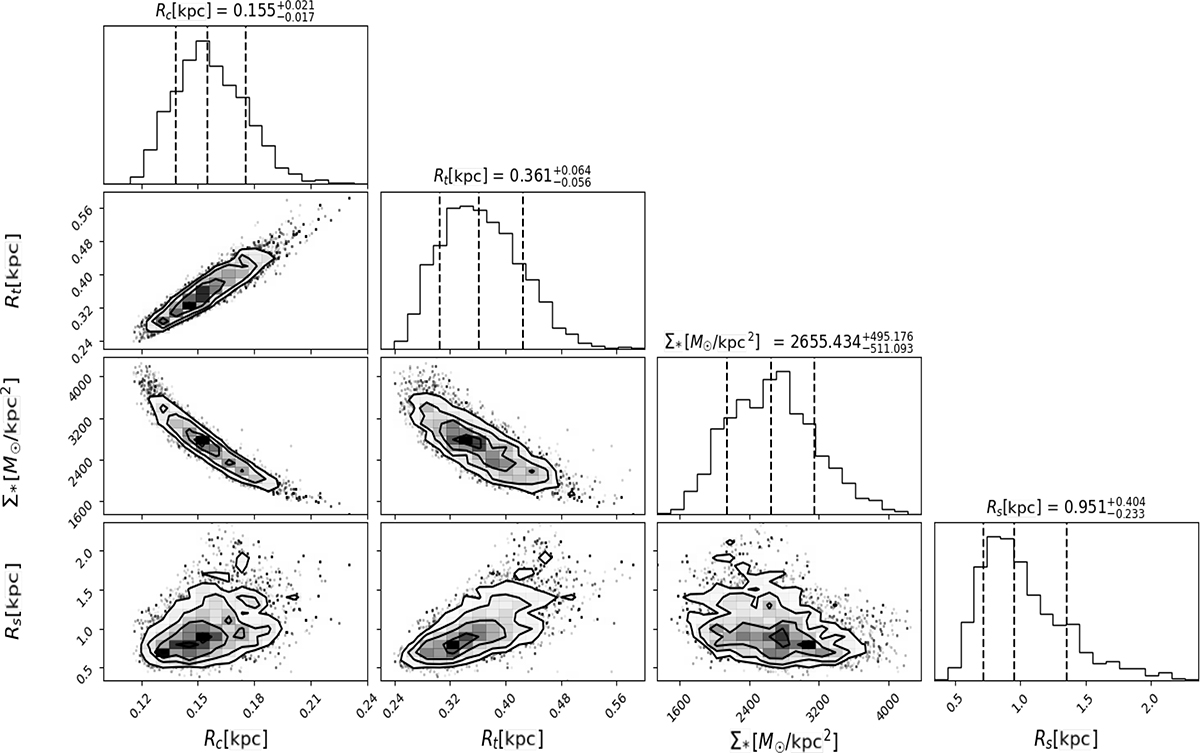
Fig. C.1.
Download original image
Respective corner plot of figure 6. This figure displays the correlated distributions of the free parameters. The core radius and transition radius are particularly well defined, even with the Gaussian input priors, indicating a reliable result. The contours in the plot represent the 68%, 95%, and 99% confidence levels, providing a visual representation of the parameter uncertainties. The best-fit parameter values, along with their respective errors, are indicated by the dashed black lines. These values are also listed in Table 1 for easy reference.
Current usage metrics show cumulative count of Article Views (full-text article views including HTML views, PDF and ePub downloads, according to the available data) and Abstracts Views on Vision4Press platform.
Data correspond to usage on the plateform after 2015. The current usage metrics is available 48-96 hours after online publication and is updated daily on week days.
Initial download of the metrics may take a while.