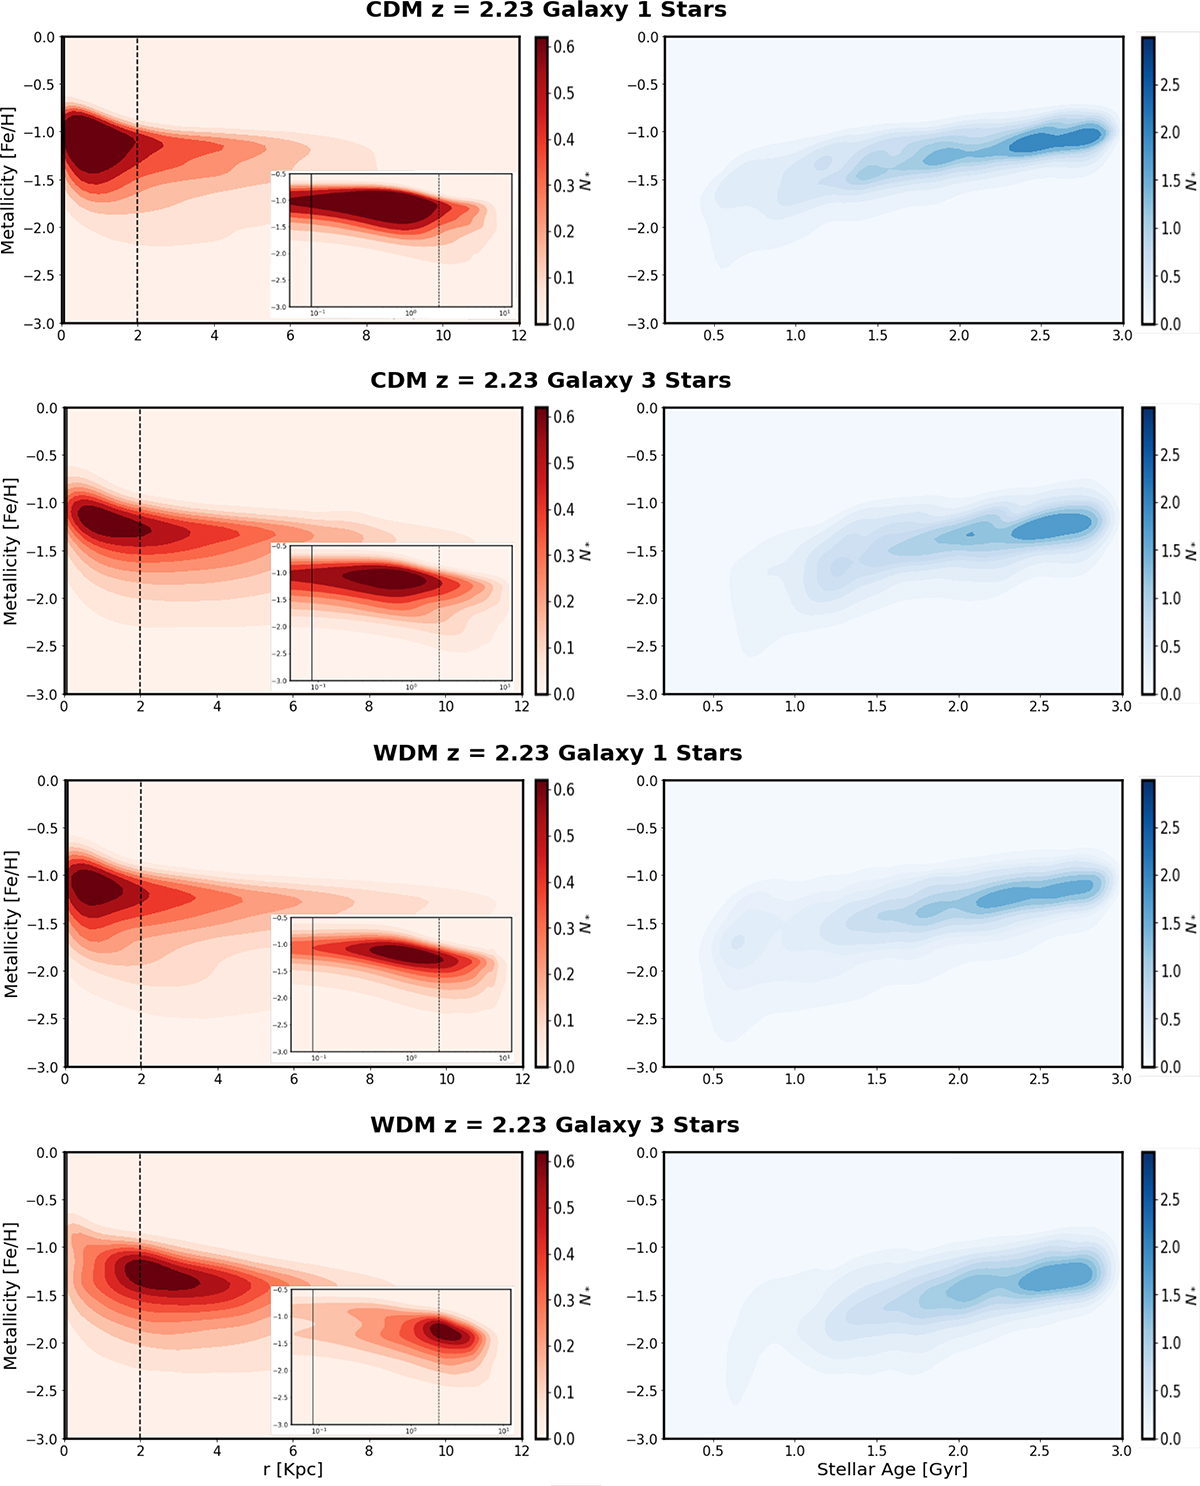
Fig. A.2.
Download original image
Left panel: 2D correlation of the stellar distance vs. stellar metallicity. It is evident that metal-rich stars tend to be located closer to the galactic center. However, there is a notable offset for “WDM”G3, suggesting a unique distribution pattern for this specific galaxy. The small subpanels provide a logarithmic scale representation for enhanced visualization. The vertical black line signifies the comoving limit, while the dashed line represents the ideal size of a core-halo structure. Right panel: 2D correlation of stellar age vs. metallicity. The negative Spearman correlation coefficient indicates that older stars are more likely to be metal-poor, while younger stars tend to be more metal-rich. This relationship holds across all DM models.
Current usage metrics show cumulative count of Article Views (full-text article views including HTML views, PDF and ePub downloads, according to the available data) and Abstracts Views on Vision4Press platform.
Data correspond to usage on the plateform after 2015. The current usage metrics is available 48-96 hours after online publication and is updated daily on week days.
Initial download of the metrics may take a while.