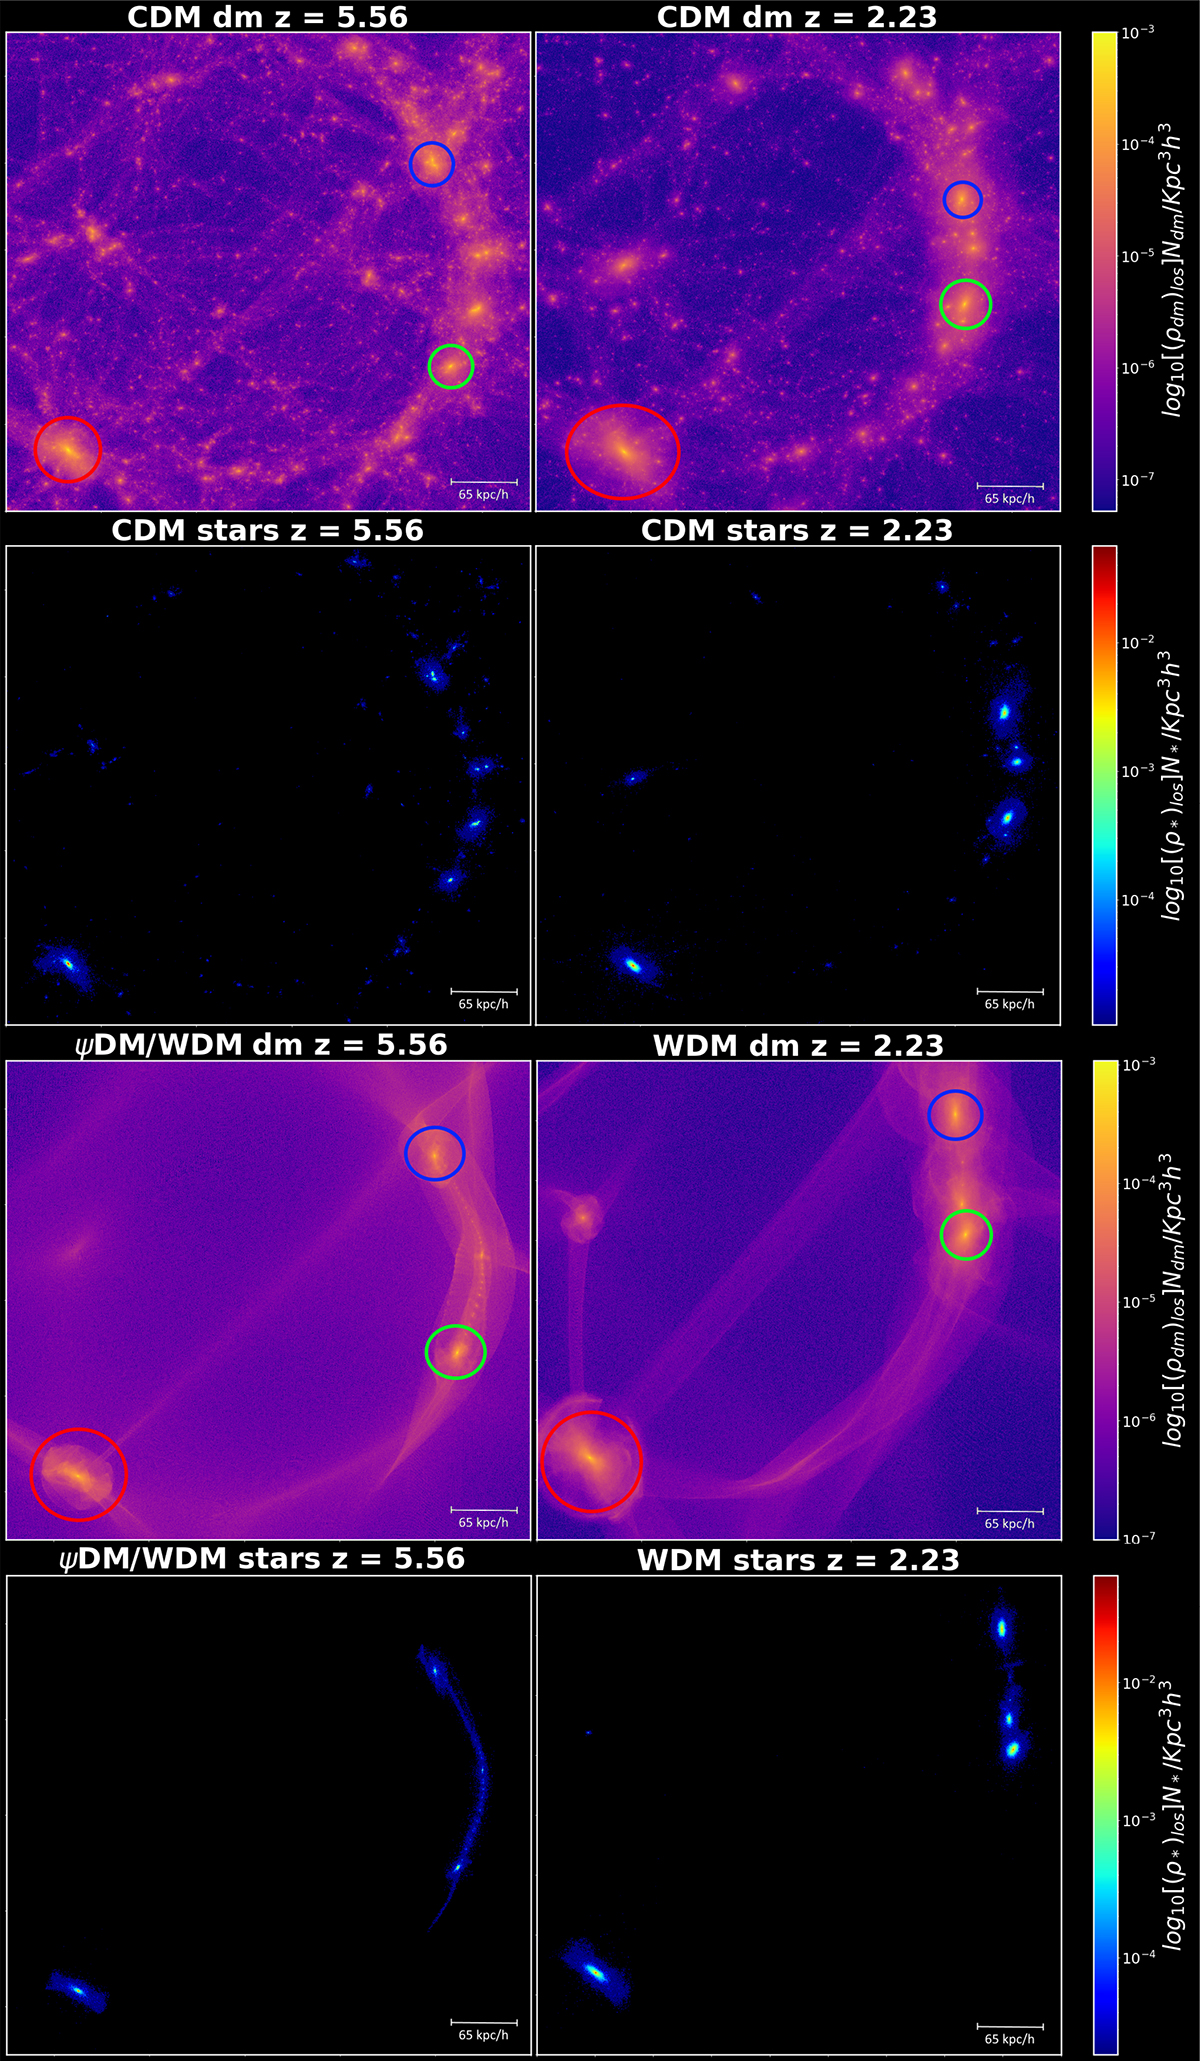
Fig. 1.
Download original image
Logarithmic (comoving) projected densities along the line of sight from the study by Mocz et al. (2019). The projection is performed along the entire line-of-sight dimension of the simulation box. The first row shows the profiles for DM in the context of CDM, and the second row displays the corresponding profiles for stars. The third and fourth rows illustrate the profiles for DM and stars in the context of ψDM–“WDM”. In each row, the left panel represents the density profile at a redshift of z = 5.56, while the right panel shows it at z = 2.23. “WDM” and ψDM exhibit remarkably similar evolutionary trends across different redshifts, suggesting their resemblance in terms of the development of large-scale structures, in contrast to CDM (Mocz et al. 2019, 2020). We have added colored circles to identify each galaxy throughout this work: Galaxy 1 (G1) marked in red, Galaxy 2 (G2) in green, and Galaxy 3 (G3) in blue.
Current usage metrics show cumulative count of Article Views (full-text article views including HTML views, PDF and ePub downloads, according to the available data) and Abstracts Views on Vision4Press platform.
Data correspond to usage on the plateform after 2015. The current usage metrics is available 48-96 hours after online publication and is updated daily on week days.
Initial download of the metrics may take a while.