Fig. 6.
Download original image
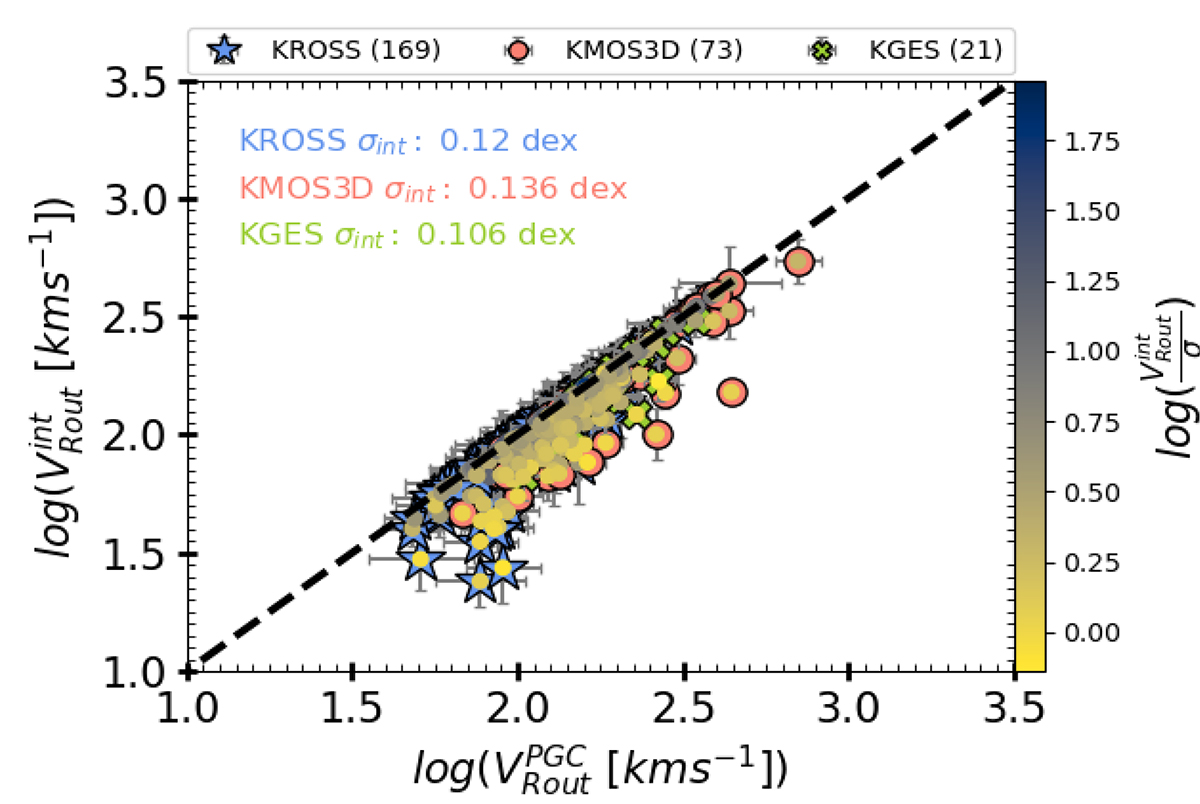
Impact of the pressure gradient on the circular velocity of galaxies computed at Rout. The KMOS3D, KGES, and KROSS samples are denoted by red circles, green cross, and blue stars, respectively. The interior of each data point is color-coded for rotation-to-dispersion ratio computed before pressure support correction (![]() ). The black dashed line represents the one-to-one relation between the two measurements. We observe that galaxies with higher velocity dispersion require large pressure corrections.
). The black dashed line represents the one-to-one relation between the two measurements. We observe that galaxies with higher velocity dispersion require large pressure corrections.
Current usage metrics show cumulative count of Article Views (full-text article views including HTML views, PDF and ePub downloads, according to the available data) and Abstracts Views on Vision4Press platform.
Data correspond to usage on the plateform after 2015. The current usage metrics is available 48-96 hours after online publication and is updated daily on week days.
Initial download of the metrics may take a while.