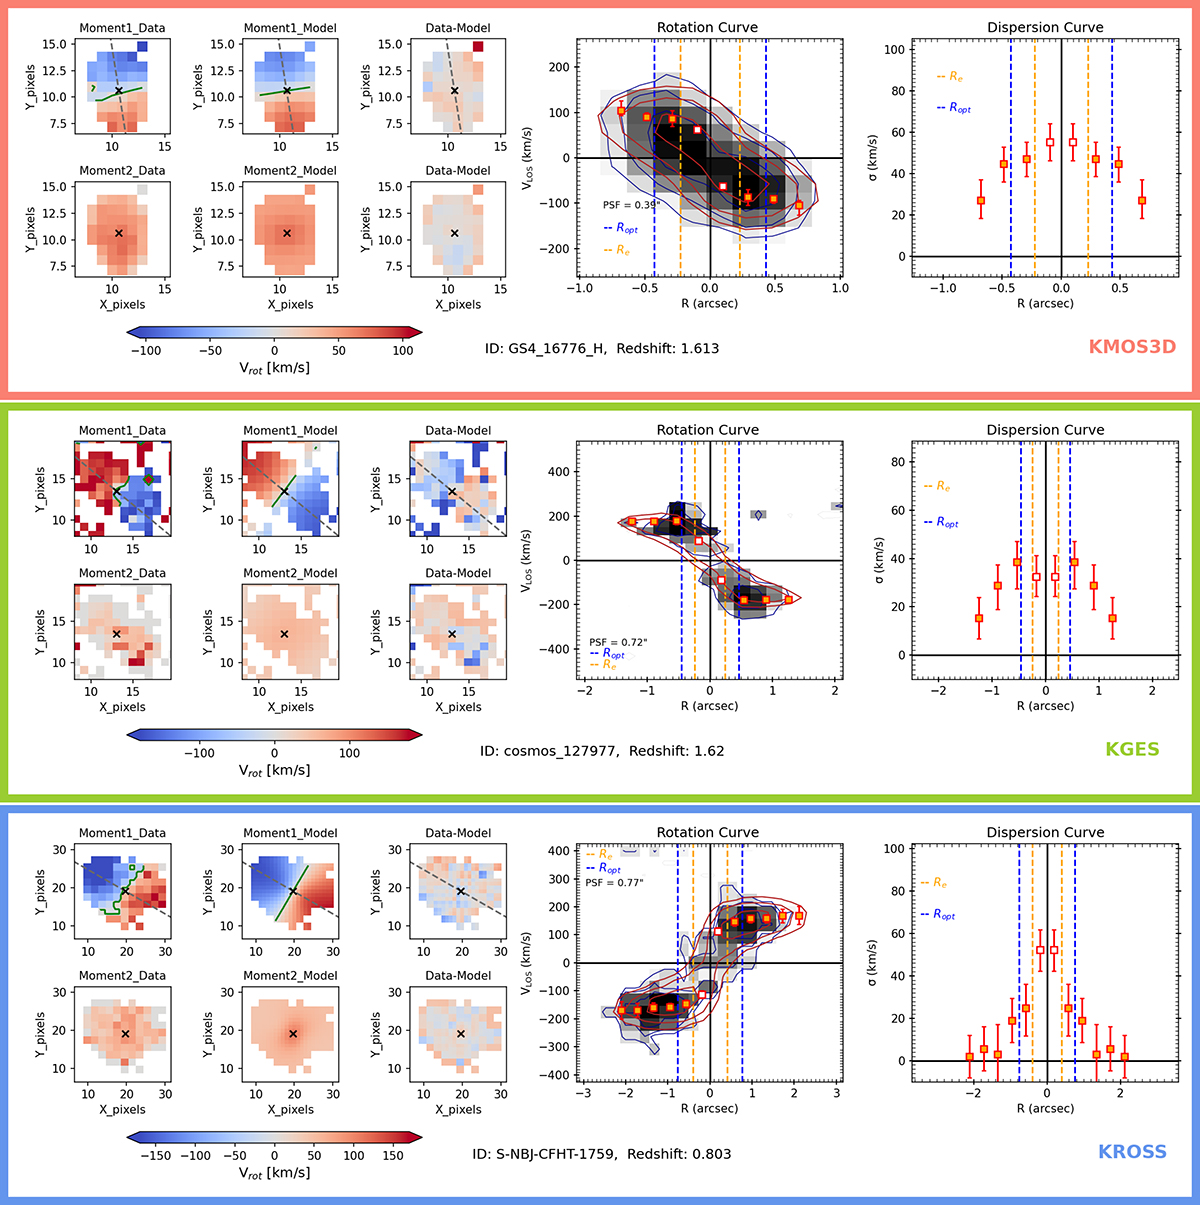
Fig. 5.
Download original image
Outputs of the kinematic modeling of selected KMOS3D (red box), KGES (green), and KROSS (blue) sources obtained using 3DBAROLO. Row-1, Columns 1-3: Rotation velocity map data, model, and residuals, respectively. The gray dashed line shows the position angle, the black cross the central x-y position, and the green line marks the plane of rotation. Row-2, Columns 1-3: Velocity dispersion map data, model, and residuals, respectively. Column 4: Major axis PV diagram, where the black shaded area with blue contour represents the data while the red contour shows the model, and the orange squares with error bars are the best-fit line-of-sight rotation velocity inferred by 3DBAROLO. The yellow and blue vertical dashed lines represent the effective radius (Re), and the optical radius (Ropt = 1.89 Re), respectively. Column 5: Corresponding velocity dispersion curve. The first point in the rotation and dispersion curves is represented by an empty (or white) marker, as it falls under the resolution limit and is therefore excluded from the data analysis.
Current usage metrics show cumulative count of Article Views (full-text article views including HTML views, PDF and ePub downloads, according to the available data) and Abstracts Views on Vision4Press platform.
Data correspond to usage on the plateform after 2015. The current usage metrics is available 48-96 hours after online publication and is updated daily on week days.
Initial download of the metrics may take a while.