Fig. 3.
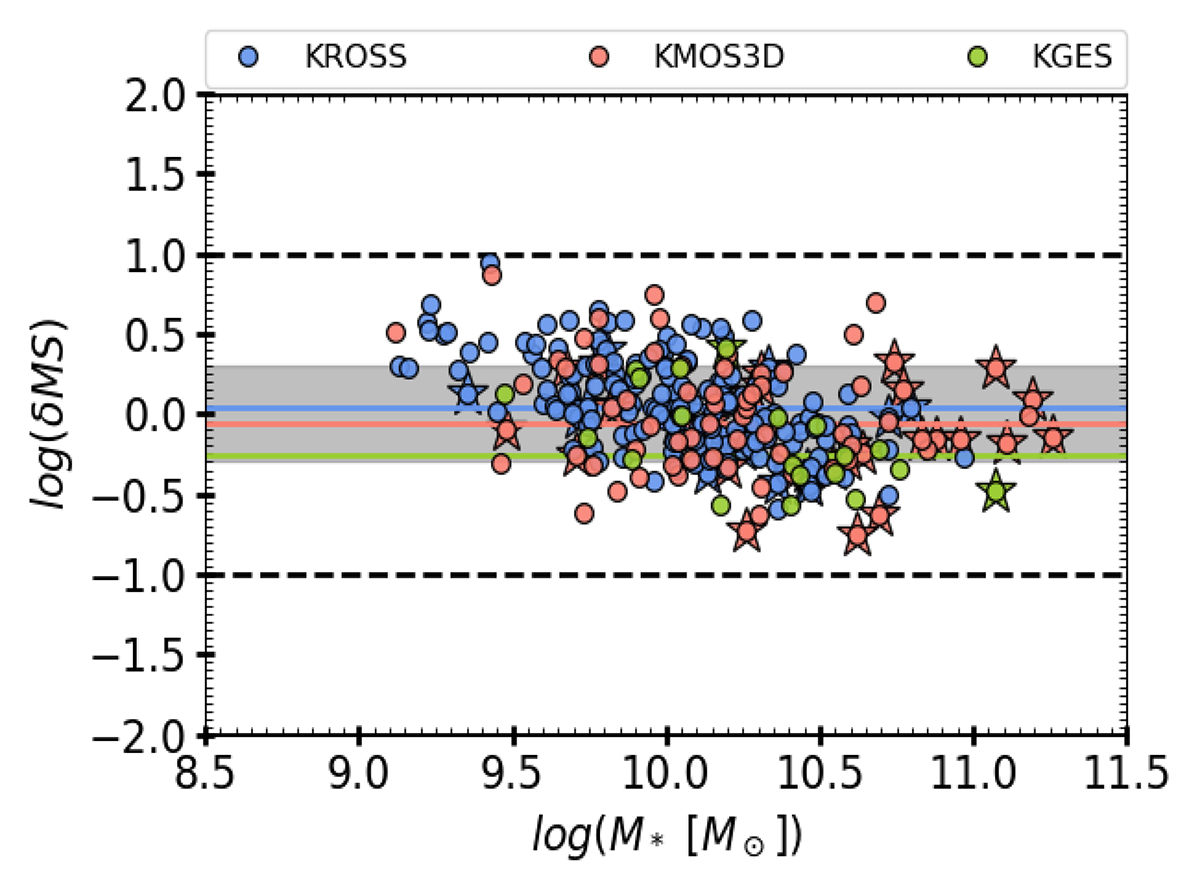
Download original image
Position of galaxies (final sample) with respect to the star-forming main sequence (MS). We plot offset from the MS, δMS (=SFR/SFR(MS; z, Mstar)) as a function of the stellar mass (Mstar) with the reference SFR(MS; z, Mstar) from Speagle et al. (2014). The gray shaded area represents the typical limit (0.3 dex) of star-forming MS (e.g., see Rodighiero et al. 2011; Genzel et al. 2015; Tacconi et al. 2018; Freundlich et al. 2019). The KMOS3D, KGES, and KROSS data are denoted by red, green, and blue filled circles, respectively. The solid lines in corresponding colors depict the average offset from the main sequence for each dataset. All galaxies are within 2σ scatter of the MS line. The galaxies marked with stars are the galaxies that have Re > PSF.
Current usage metrics show cumulative count of Article Views (full-text article views including HTML views, PDF and ePub downloads, according to the available data) and Abstracts Views on Vision4Press platform.
Data correspond to usage on the plateform after 2015. The current usage metrics is available 48-96 hours after online publication and is updated daily on week days.
Initial download of the metrics may take a while.