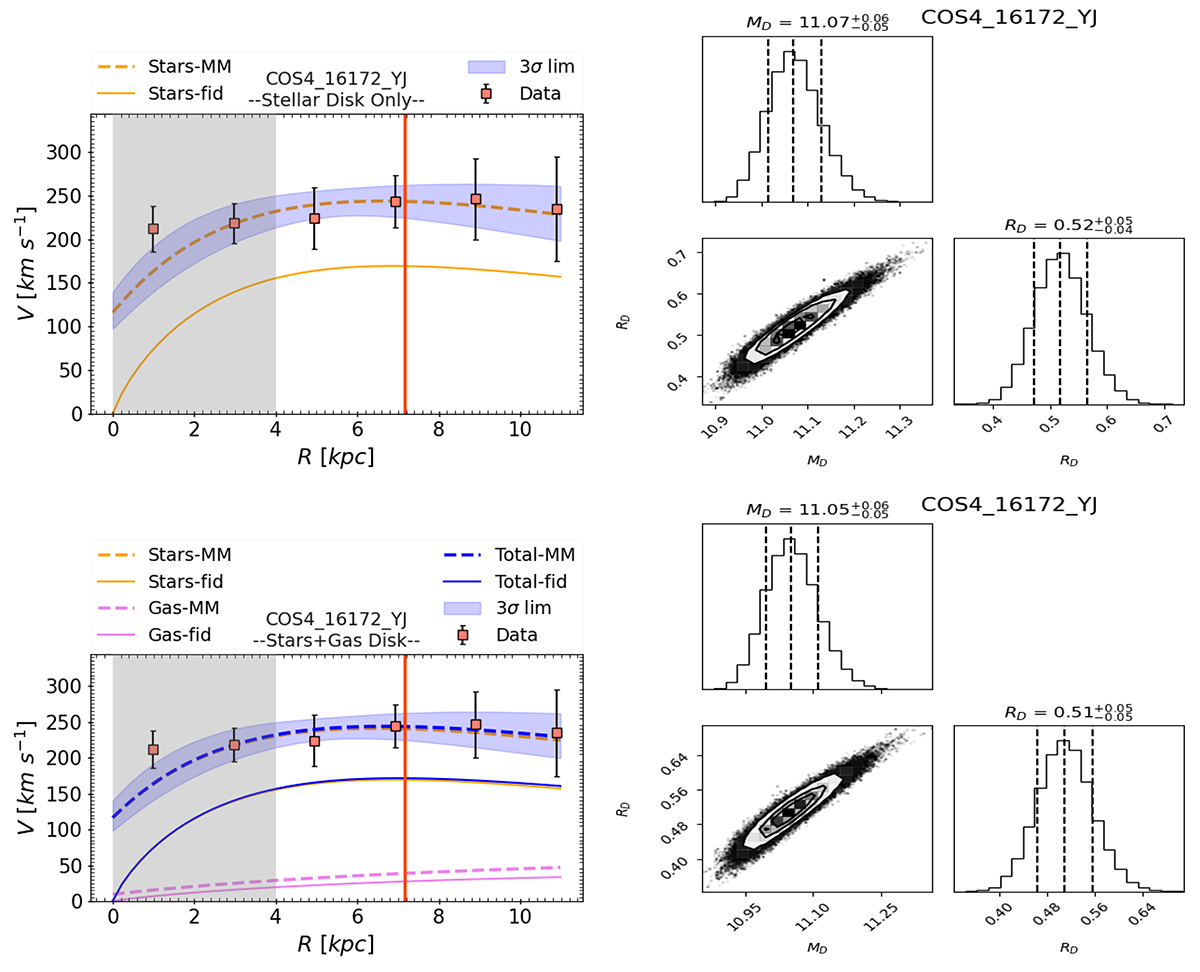
Fig. B.5.
Download original image
Examples of mass modeled rotation curves in the case of the maximum stellar disk scenario (upper panel) and maximum stellar+gas disk (lower panel). The best-fit parameters are shown in the right column, and color codes are given in the legend of the plot, where ‘MM’ stands for dynamical mass-model profiles estimated using Bayesian inference, and ‘fid’ stands for fiducial profile derived from given photometric mass. This example favors the maximum stellar and baryonic disk scenario, upper and lower panels, respectively.
Current usage metrics show cumulative count of Article Views (full-text article views including HTML views, PDF and ePub downloads, according to the available data) and Abstracts Views on Vision4Press platform.
Data correspond to usage on the plateform after 2015. The current usage metrics is available 48-96 hours after online publication and is updated daily on week days.
Initial download of the metrics may take a while.