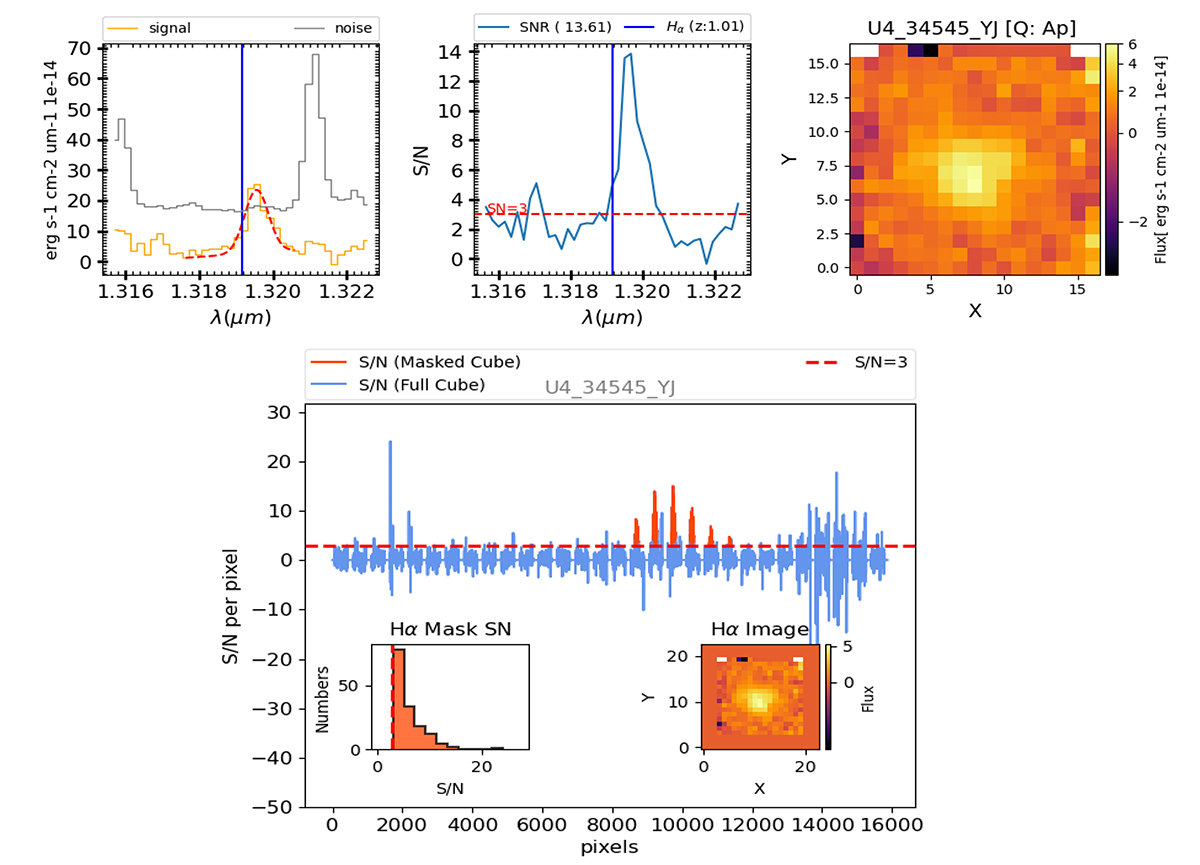
Fig. A.1.
Download original image
Example showing the S/N in datacubes. Upper Panel: S/N derived from the integrated spectra. From left to right are presented: integrated spectrum of the flux (yellow) and noise (gray) as a function of wavelength, the S/N as a function of wavelength, and the collapsed Hα image. To compute the continuum and S/N from the integrated spectra of Hα-emission, we utilized the gauss_fit module from MPDAF library, which provides the Gaussian-fit, flux at the peak emission, and average continuum. The Gaussian fit is represented by the red dashed line in the spectrum plot (first panel), and the S/N around the Hα-peak is specified in the legend of the S/N plot (middle panel). Here, we computed the S/N value with in λHα ± 0.005μm, which approximately covers the Gaussian of Hα flux. Lower Panel: S/N derived from the 1D spectra of the datacube, with blue denoting the full Hα cube and red indicating the masked region (i.e., identified Hα emission). Additionally, in same panel, we show the distribution of S/N in the mask and the collapsed Hα images, left and right small windows, respectively. We compare the S/N of the integrated spectra (upper row, middle panel) with the S/N distribution of 1D spectra (lower panel, left zoom-in window). Throughout the analysis, we observe that the average S/N of the 1D spectra is approximately similar to the value obtained from the integrated spectra. This justifies our S/N measurement techniques.
Current usage metrics show cumulative count of Article Views (full-text article views including HTML views, PDF and ePub downloads, according to the available data) and Abstracts Views on Vision4Press platform.
Data correspond to usage on the plateform after 2015. The current usage metrics is available 48-96 hours after online publication and is updated daily on week days.
Initial download of the metrics may take a while.