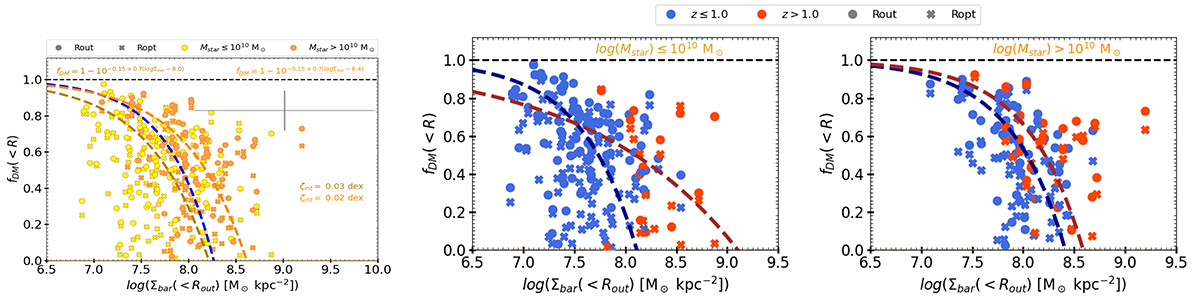
Fig. 14.
Download original image
Exploration of the fDM − Σbar relation across different stellar masses and redshift intervals. First panel: fDM − Σbar relation for the low-stellar mass bin (Mstar ≤ 1010 M⊙) in yellow and the high-stellar mass bin (Mstar > 1010 M⊙) in orange. The original best-fit to fDM − Σbar relation is shown blue dashed line, while the best fit of low- and high-stellar mass bins are shown by brown and orange dashed lines, respectively. Second-third panel: fDM − Σbar relation separated for low- and high-stellar masses, left and right panels respectively. In both panels, low-z (z ≤ 1) and high-z (z > 1) galaxies are shown in blue and red, respectively, and corresponding best fits are shown in dark blue and red dashed-lines. In the first panel, median error on the data points is indicated by gray cross. The filled crosses & circles represent the measurements taken within Ropt and Rout, respectively. We note to the reader that these relations are plotted exclusively for objects with fDM > 0, while the full sample is shown in Figure 13.
Current usage metrics show cumulative count of Article Views (full-text article views including HTML views, PDF and ePub downloads, according to the available data) and Abstracts Views on Vision4Press platform.
Data correspond to usage on the plateform after 2015. The current usage metrics is available 48-96 hours after online publication and is updated daily on week days.
Initial download of the metrics may take a while.