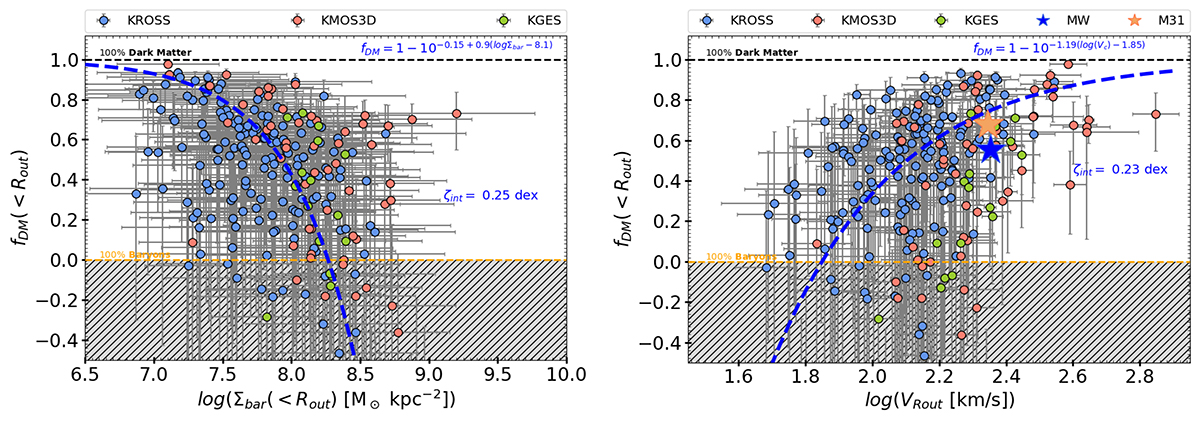
Fig. 13.
Download original image
Scaling relations of dark matter, fDM − Σbar and fDM − Vc, shown in the left and right panels, respectively. The blue dashed line represents the best fit to the data in both relations, with the associated intrinsic scatter (ζint) indicated on the plot. We note that the fDM − Vc relation can be seen as the result of a combination of the mass-velocity and mass-size relations. The color codes used for data in both panels are consistent with Figure 11. We note that the uncertainties on data points represent the 68% confidence interval.
Current usage metrics show cumulative count of Article Views (full-text article views including HTML views, PDF and ePub downloads, according to the available data) and Abstracts Views on Vision4Press platform.
Data correspond to usage on the plateform after 2015. The current usage metrics is available 48-96 hours after online publication and is updated daily on week days.
Initial download of the metrics may take a while.