Fig. 12.
Download original image
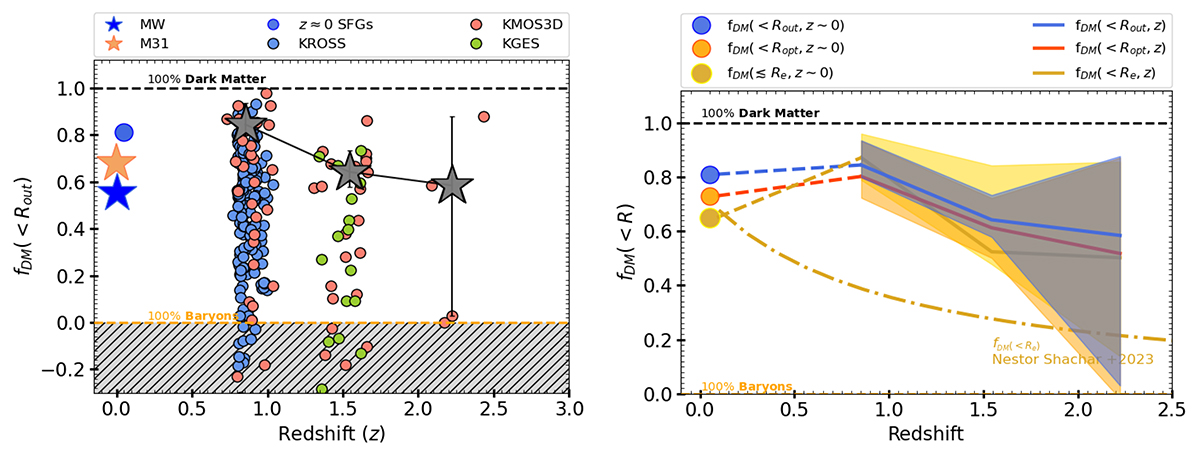
Dark matter fraction across the cosmic time. Left panel: Dark matter fraction within Rout as a function of redshift. The color codes of datasets are same as Figure 11, and given in the legend of the plot. The gray stars represents the binned data points with 1σ uncertainty shown by error-bars. Right panel: Averaged dark matter fraction within Re, Ropt, and Rout as a function of redshift, represented by yellow and blue lines, respectively. The bootstrap-errors representing 68% confidence interval are indicated by shaded areas color-coded with the same color as the averaged line. Dark matter fraction of local star-forming galaxies within Ropt and Rout are from Persic et al. (1996), and within Re they are taken from disk galaxy survey of Courteau & Dutton (2015). The uncertainties on these measurements are, on average, ±0.25. The color code of these estimates are same as high-z galaxies. The dark-yellow dotted-dashed lines shows the dark matter fraction within Re from Nestor Shachar et al. (2023).
Current usage metrics show cumulative count of Article Views (full-text article views including HTML views, PDF and ePub downloads, according to the available data) and Abstracts Views on Vision4Press platform.
Data correspond to usage on the plateform after 2015. The current usage metrics is available 48-96 hours after online publication and is updated daily on week days.
Initial download of the metrics may take a while.