Fig. 10.
Download original image
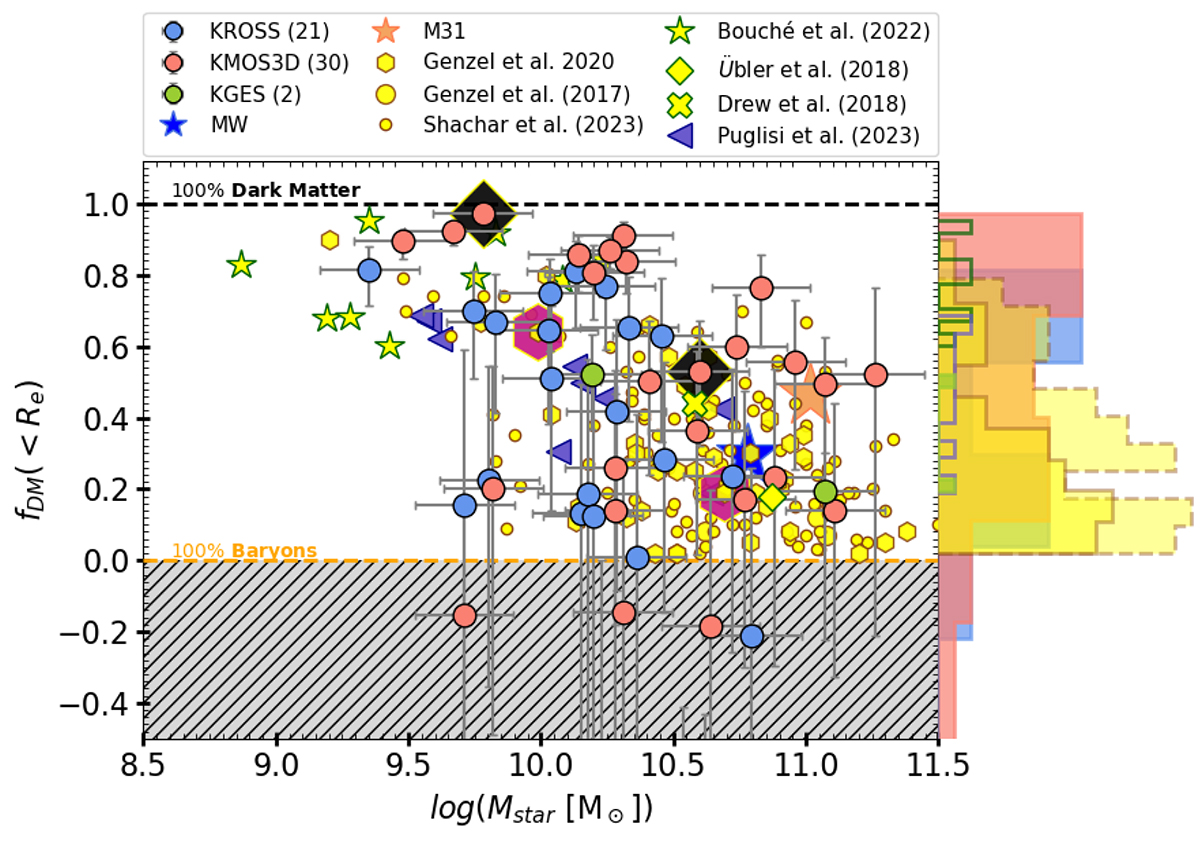
Dark matter fraction within Re as a function of stellar masses for galaxies having Re > PSF. The KMOS3D, KGES, and KROSS datasets are depicted in red, green, and blue colors, respectively. The errors on the datasets are 68% confidence intervals. For comparison, we include two local massive disk galaxies: the Milky Way (MW) and Andromeda (M31), represented by the blue and the orange star, respectively. Additionally, we compare these results with previous studies at high redshift, such as Genzel et al. (2017, yellow circles), Genzel et al. (2020, yellow hexagons), Nestor Shachar et al. (2023, yellow dots), Bouché et al. (2022, yellow star), Übler et al. (2018, yellow diamond), Drew et al. (2018, yellow cross), and Puglisi et al. (2023, purple triangle). The black square represents the two galaxies that are in-common with Genzel et al. (2020) drawn from this work, while pink hexagons shows the measurements of same objects from Genzel et al. (2020). The black and yellow horizontal dashed lines represent the regimes of 100% dark matter dominance and baryon dominance, respectively. The gray shaded area indicates the ‘forbidden’ region, where galaxies with Mdyn < Mbar are located. Horizontal histograms (aligned to the right y-axis) compare datasets: KMOS3D, KGES, and KROSS (filled red, green, and blue hists), Genzel et al. (2017, 2020) (yellow fill with solid brown line), Nestor Shachar et al. (2023) (yellow fill with dashed brown line), and Bouché et al. (2022) and Puglisi et al. (2023) (open histograms in green and purple, respectively).
Current usage metrics show cumulative count of Article Views (full-text article views including HTML views, PDF and ePub downloads, according to the available data) and Abstracts Views on Vision4Press platform.
Data correspond to usage on the plateform after 2015. The current usage metrics is available 48-96 hours after online publication and is updated daily on week days.
Initial download of the metrics may take a while.