| Issue |
A&A
Volume 698, June 2025
|
|
|---|---|---|
| Article Number | L20 | |
| Number of page(s) | 15 | |
| Section | Letters to the Editor | |
| DOI | https://doi.org/10.1051/0004-6361/202554911 | |
| Published online | 16 June 2025 | |
Letter to the Editor
The Peekaboo galaxy: New SALT spectroscopy and implications of archive HST data
1
South African Astronomical Observatory, PO Box 9 7935 Observatory, Cape Town, South Africa
2
Southern African Large Telescope Foundation, PO Box 9 7935 Observatory, Cape Town, South Africa
3
Sternberg Astronomical Institute, Lomonosov Moscow State University, Moscow, Russia
4
Special Astrophysical Observatory of RAS, Nizhnij Arkhyz, Karachai-Circassia 369167, Russia
⋆ Corresponding authors: This email address is being protected from spambots. You need JavaScript enabled to view it.
; This email address is being protected from spambots. You need JavaScript enabled to view it.
Received:
31
March
2025
Accepted:
17
May
2025
Abstract
Context. The dwarf galaxy Peekaboo (HIPASSJ1131–31) was recently identified as a local volume (LV) gas-rich and extremely metal-poor (XMP) dIrr. Its gas metallicity is Z ∼ Z⊙/50, with a ±1σ uncertainty range of [Z⊙/72–Z⊙/35]). Its ‘tip of the red-giant branch’ distance is 6.8 ± 0.7 Mpc. The Hubble Space Telescope (HST) data for its individual stars revealed that its older red-giant-branch stars comprise a smaller part of the galaxy, while the majority of visible stars have ages of less than one to a few gigayears. Thus, the Peekaboo dwarf can be considered as the nearest record-low Z dwarf. As such, the galaxy deserves a deeper multi-method study that examines the properties of its young massive stars and the fainter older population as well as its ionised gas and the dominant baryonic component of HI gas.
Aims. We aim to obtain the higher S-to-N SALT optical spectra of two H II regions in Peekaboo in order to improve the accuracy of its gas O/H and to determine abundances of Ne, S, N, and Ar. With archive HST images, we aim to identify the hot massive stars, including exciting the two H II regions (i.e. east and west), and the XMP supergiants as important targets for follow-up studies of their evolution with upcoming extremely large telescopes.
Methods. We used the direct (Te) method for the east H II region in which a [O III]λ4363 Å line is well detected in order to estimate its parameter 12 + log(O/H). In the west H II region, the line [OIII]λ4363 Å is not detected, so we estimated its O/H via the empirical ‘strong-line’ method of Izotov et al. (2019, A&A, 523, A40). The resulting value of O/H is very close to that in the east H II region.
Results. The new spectroscopy of the Peekaboo dwarf allowed us to substantially improve the accuracy of its direct O/H estimate, and we obtained 12 + log(O/H) = 6.99 ± 0.06 dex. The new data reveal that emission lines in the east region consist of two components with a velocity difference of ∼65 km s−1. The fainter approaching component could be related to a fast-moving WR star thrown from a cluster or a binary system. Using the HST V magnitudes and colour V − I, we identified tentative O-type and very hot candidate WO stars, which are likely the ionising stars of the studied H II regions.
Conclusions. With the new optical spectra, the Peekaboo galaxy is confirmed as the lowest-metallicity dwarf in the LV and as a valuable object for in-depth multi-method studies. We separate its most luminous stars for follow-up ground-based brightness monitoring and spectroscopy.
Key words: galaxies: abundances / galaxies: individual: HIPASSJ1131–31 / stars: massive / stars: evolution
© The Authors 2025
 Open Access article, published by EDP Sciences, under the terms of the Creative Commons Attribution License (https://creativecommons.org/licenses/by/4.0), which permits unrestricted use, distribution, and reproduction in any medium, provided the original work is properly cited.
This article is published in open access under the Subscribe to Open model. This email address is being protected from spambots. You need JavaScript enabled to view it. to support open access publication.
1. Introduction
The ‘local’ gas-rich extremely metal-poor (XMP) dwarfs are interesting objects since they challenge modern cosmological models of galaxy formation and evolution, and they allow one to check the predictions of such models for the formation and survival of objects with extreme properties. Based on the sum of their observational properties, gas-rich XMP dwarfs appear to be similar to galaxies in the early stages of evolution.
The existence of such unusual, very rare, so-called very young galaxies (VYGs) was predicted in N-body simulations (Tweed et al. 2018). The VYGs are galaxies that formed the major part of their stellar mass within the last 1 Gyr. While VYGs are expected to be very rare, their proportion in simulations strongly depends on the type of dark matter employed (i.e. cold DM versus warm DM).
Apart from the limitations on the cosmological models that the statistics of XMP VYGs can imply, their study is of interest in at least in two more areas. Firstly, this is due to the expected similarity of their properties to those of young galaxies in the early Universe (very gas rich and very metal poor). Being at the distances of the Local Volume (LV) and its environs, XMP VYGs allow one to obtain much deeper insights into their properties and to tie them to the processes of galaxy formation in the early Universe.
The other important issue is related to stellar physics and galaxy evolution. Namely, it concerns the basic understanding of the formation and evolution of massive stars and their feedback into the interstellar medium of their parent galaxies (e.g. Eldridge & Stanway 2022). For the cosmology of the early Universe, it is especially crucial to understand the properties and the evolution of the massive stars with metallicities tens to hundreds of times lower than the solar one Z⊙. Such massive, very low Z stars can be found in only a handful of XMP dwarf galaxies within the LV and its environs (Garcia et al. 2021). If identified, such XMP massive stars can be the primary targets of spectroscopic studies using the next generation ground-based telescopes. In the meantime, the first steps in this direction have already been presented for a nearby dIrr Leo A with Z ∼ 0.03 Z⊙ by Gull et al. (2022) and for four low-metallicity galaxies, including Leo P with Z ∼ 0.025 Z⊙ by Telford et al. (2024).
The Peekaboo galaxy, the optical counterpart of the HI source HIPASS J1131–31, got its name from the fact that it was hidden within the halo of a nearby bright star (Koribalski et al. 2018). The galaxy was recently described and studied by Karachentsev et al. (2023). As that paper reports, the “Peekaboo dwarf is a faint (MV = −11.27 mag), the Local Volume (LV) gas-rich dIrr at the TRGB-based distance of 6.8 Mpc (distance module = 29.2 mag). Its gas metallicity, derived with the direct Te method, appeared one of the lowest of the known so far (12 + log(O/H) = 6.99 ± 0.16 dex)”. The cited uncertainties of O/H correspond to the Z range of a factor of two: [Z⊙/72–Z⊙/35]). The authors also discussed the probable “youth” of this galaxy and highlighted the abnormally small population of aged red-giant-branch stars.
In this Letter, using new SALT spectroscopy, we update the estimate of Peekaboo’s metallicity and substantially improve on its accuracy. We also used archive Hubble Space Telescope (HST) images and Extragalactic Distance Database (EDD)1 (Tully et al. 2009) photometry of Peekaboo’s stars to identify the hot massive stars ionising the two H II regions and several of the brightest supergiants. The latter can be attractive targets for HST and extremely large telescope (ELT) spectral studies, as the record-low metallicity massive evolved stars.
The layout of the Letter is as follows. In Sect. 2, the data and analysis are briefly described. Sect. 3 presents the main results. These results are discussed in Sect. 4 and summarised in Sect. 5. Details of the data and results are shown in the appendices. The scale we adopted is 34 pc in 1 arcsec.
2. Observations and data analysis
2.1. SALT observations and analysis
We carried out long-slit optical spectroscopic observations of the Peekaboo galaxy using the Robert Stobie Spectrograph (RSS; Burgh et al. 2003; Kobulnicky et al. 2003) installed at the Southern African Large Telescope (SALT; Buckley et al. 2006; O’Donoghue et al. 2006). Different Volume Phase Holographic (VPH) gratings were used with the long slit of 1.5″ by 8′ to cover the full spectral range from 3600 Å to 7250 Å. The position angle for all observations was 87.88°, and the slit position was exactly the same as shown in Figure 6 of Karachentsev et al. (2023), where a reference star was used to put the slit in exactly the same position for different observations. A complete list of details is shown in Table 1, where all dates, seeing, covered spectral range, spectral scale, and full width at half maximum (FWHM) are shown. The final spectrum taken with grating PG0900 was used as a basic one since it covers the greatest spectral range. Spectral data obtained using other gratings were processed independently, and emission lines were measured in the same spatial areas. After that, the line fluxes, measured on the spectra obtained with other gratings, were recalculated to the flux system obtained using the PG900 grating. Namely, the total fluxes of the bright lines, measured on spectra for both gratings, were used to determine the conversion factor, and then the fluxes for the weaker lines were re-calculated using this factor. Spectrophotometric standards were observed at twilight as part of the SALT standard calibration plan.
Journal of the SALT observations.
Given that SALT is equipped with an atmospheric dispersion compensator (ADC), the effect of atmospheric dispersion at an arbitrary long slit PA is negligible. Additionally, SALT’s design incorporates the movement of the telescope’s pupil during tracking, thereby resulting in constant alteration of the telescope’s effective area. Therefore, accurate absolute photometry and spectrophotometry are not possible. However, relative flux calibration can be used. Thus, the relative energy distribution in the spectra can be obtained with SALT data.
Fortunately in our research, we had the reference star on the slit and its known magnitudes in several bands from the Legacy DR10 database Li et al. (2024). Therefore, we used this star as a local standard to derive the line fluxes and luminosity of Hβ. (See details in Appendix B.)
The primary data reduction was done with the SALT science pipeline (Crawford et al. 2010). The long-slit reduction was done with the RSS pipeline described by Kniazev (2022). The 1D spectra extraction, emission lines measurement, and calculation of chemical abundances was done in the way described by Kniazev et al. (2008). The fully reduced 2D spectra of Peekaboo are shown in Figure B.1, and the most prominent lines are labelled. Since the RSS detector is a mosaic and consists of three CCDs, the positions of two gaps between these CCDs are also shown.
Errors in line intensities have been propagated in the calculations of the reddening correction, electron temperatures, and densities and have been propagated to the elemental abundance errors. The observed emission line intensities, F(λ), relative to the F(Hβ) line and the intensities, I(λ), corrected for interstellar extinction and underlying stellar absorption are presented in Table D.1. The equivalent width, EW(Hβ), of the Hβ line; the calculated absorption equivalent widths, EW(abs), of the Balmer lines; the extinction coefficient, C(Hβ) – which is a sum of the internal extinction in Peekaboo and foreground extinction in the Milky Way; and the subsequently recalculated E(B − V) value are also listed there.
2.2. Hubble Space Telescope data
Hubble Space Telescope data are well described by Karachentsev et al. (2023). Here, we used the information on positions, magnitudes, and colours of the hottest stars as the potential exciting stars of the observed H II regions. The evolved luminous stars (supergiants) are also identified with these data, and they should be valuable in more advanced studies of the lowest metallicity massive stars using upcoming facilities, including ELTs.
In Figure A.1, we show two zoomed-in HST images. In the top panel, we show an image in the F606W filter, and all the stars are marked with their numbers in Table E.1. These are the same set of stars as in the paper by Karachentsev et al. (2023). In the bottom panel, we present the colour HST image of the same area of Peekaboo taken from the HST archive (Prog. SNAP 15992, PI R.B. Tully).
3. Results
3.1. Structure and kinematics of the main H II regions
Analysis of the long-slit spectra revealed the presence of two distinct H II regions. Figure B.2 shows the profile of the Hα line along the slit based on the spectral data obtained with the PG900 grating. The figure clearly shows two regions, which we refer to as regions ‘E’ (east) and ‘W’ (west) since the slit was oriented roughly in the east-west direction across the galaxy. These regions appear as two peaks in the Hα profile, although they are less pronounced in the continuum profile. Region W is fainter, with an extent of about 3 arcsec, while the brighter region E extends over about 5 arcsec. We defined approximate boundaries for these regions (as shown in the figure) in order to extract 1D spectra along the slit. The aim was to minimise spectral contamination between the regions while maximising the useful signal from the emission lines. The selected region boundaries are also shown in the Figure B.1 as red horizontal lines and in the top panel of Figure A.1 as red circles centred on the reference star with the corresponding radii. These boundaries were applied consistently to all the acquired spectral data. The 1D spectra obtained by summing within these limits are shown in Figures C.1 and C.2.
A more detailed analysis of the extracted 1D spectra uncovered an interesting peculiarity. Namely, all the observed emission lines in the spectrum of region E appear as a double component. Every line exhibits an asymmetric blue wing. To test the hypothesis that all the lines represent two velocity components, we first fit each line with a single Gaussian and then with a two-Gaussian model. The related improvement of the reduced χ2 statistic was evaluated, and we found the improvement to be very significant. For various lines, it varies by a factor of ∼2–6.5. Examples of the fitting for Hβ and [O III]λ5007 Å lines and Hδ and Hγ, for gratings PG900 and PG3000 are presented in Figures C.3 and C.4, respectively.
We calculated the radial velocities of the two components in the E region and that of the W region, taking the weighted means on the three independent measurements with grisms PG900, PG1800, and PG3000. In turn, each of these velocities was derived from the redshifts of six to seven of the strongest emission lines. The final values of Vhel for these three subsystems are as follows: East(red): 721 ± 10 km s−1; East(blue): 656 ± 3 km s−1; and West: 697 ± 6 km s−1. For further discussion, we accepted these three Peekaboo ionised gas systems, of which East(red) and East(blue) are co-spatial within the limits of our modest spatial resolution.
3.2. New estimates of O/H and other elements
The measured and corrected line fluxes of atoms H and He and ions of O, N, Ne, S, and Ar and the derived element abundances of O, N, Ne, S and Ar are presented in Tables D.1 and D.2. Here, we briefly summarise the obtained results.
In Sect. 3.1, we found that there are three separate subsystems on the slit. For the East(red) subsystem, the line [O III]λ4363 was detected at the level of 6.5σ. This allowed us to directly determine the electron temperature, Te, and derive the oxygen as well as other element abundances via the direct method. We obtained its 12 + log(O/H)(Te) = 6.99 ± 0.06 dex. The two non-direct methods, described in Appendix D, give for the same subsystem, the O/H values within 0.02–0.03 dex of the former. For the West and the East(blue) subsystems, the line [O III]λ4363 was not detected. Their O/H were derived with the ‘strong-line’ method of Izotov et al. (2019). For both objects, the derived O/H is within 0.02–0.03 dex from (O/H)(Te) of the East(red).
3.3. Hubble Space Telescope data on XMP stars in the Peekaboo dwarf
In the EDD (Anand et al. 2021) there is a table with parameters of all 56 individual stars within the Peekaboo dwarf body. We sorted the stars by colour (V−I)0 and separated the hottest stars with (V−I)0 ≲ −0.25 (see Sect. 4.2), which are expected to ionise the surrounding gas. We then looked for the stars that fall within (or near) the borders of the E and W H II regions. They are the stars most likely exciting these H II regions.
There are also several supergiants in this XMP dwarf that are very interesting since they are the nearest massive evolved stars with a record-low metallicity. They represent attractive targets for spectral study with HST and next generation ELTs. (See the top panel of Fig. A.1 with the HST image of Peekaboo, where the positions of these stars are indicated.) Most of the remaining stars with (V − I) of ∼0.0–0.5 mag and MV ≲ −2.5 mag probably belong to the blue helium burning type (BHeB) with ages less than ∼200 Myr (McQuinn et al. 2012).
4. Discussion
4.1. Metallicity of Peekaboo in context
The new determination of O/H in the Peekaboo dwarf is close to the earlier value but has a much improved accuracy: 12 + log(O/H)dir = 6.99 ± 0.06 dex. We compared this value with that of known dwarfs that have the lowest metallicities in the LV. To the best of our knowledge, within the LV (R ≲ 11 Mpc), apart from Peekaboo, ten XMP dwarfs with 12 + log(O/H) ≤ 7.17 dex (or Z(gas) ≤ 0.03 Z⊙) have been found. Six of them are published in Pustilnik et al. (2010, 2021, 2024a), Skillman et al. (2013), Izotov et al. (2012). (See Table E.3 in Appendix, where we compile their properties.) Five of these six dwarfs reside within the nearby voids from Pustilnik et al. (2019). In the framework of the ongoing project ‘Studying the void galaxies in the Local Volume’, we found four new LV XMP dwarfs, currently prepared for publication. Only four of the total 11 LV XMP galaxies (including Peekaboo) have their O/H derived with the direct method.
The dwarf Leo P, with 12 + log(O/H) = 7.17 dex (Skillman et al. 2013), is the nearest known XMP galaxy, at ∼1.6 Mpc from the Local Group centre. Its proximity allows for study of its massive hot XMP star O7–8 V with ground-based spectroscopy and important constraints of its wind properties to be obtained (Telford et al. 2023, 2024). The remaining LV XMP dwarfs are situated much farther away, at the distances of ∼7–11 Mpc. Thus, spectroscopy of their luminous stars should be available with HST and upcoming ELTs.
4.2. Hot and luminous stars, and blue outliers
The proximity of Peekaboo and the high resolution of the HST images allow one to identify the hottest massive stars, including stars ionising the E and W H II regions. We separate in the diagram of MV versus (V − I) in Fig. E.1 a region where all O-stars (for luminosity classes from V to I) fall according to the state-of-the-art models at a metallicity of Z= Z⊙/10 presented by Lorenzo et al. (2025). This area is indicated by a rectangle with boundaries of (V−I)0 from −0.32 to −0.25 mag and MV between −3.30 and −6.15 mag. A list of the stars in this area and their additional parameters is presented in the appendix. In Fig. E.1, we also identify four supergiant stars, the evolved massive stars, conditionally with MV ≤ −6.0 mag (or 21.4 ≤ V≲ 23.5 mag). They probably represent the upper part of blue helium burning stars, according to McQuinn et al. (2012). They are interesting for detailed studies, as they represent the nearest evolved massive stars with a record-low metallicity.
In particular, they can be observed spectroscopically at superb conditions (i.e. narrow slit and a seeing of ≤0.5 arcsec) with the Very Large Telescope at ESO. In addition, there is a good opportunity to check their possible large-amplitude optical variability via monitoring of the entire galaxy and to analyse the light variations of the small regions around the supergiants. A successful example of monitoring the variability of the XMP LBV and other supergiants in H II regions of the XMP galaxy DDO68 (12 + log(O/H) = 6.98–7.3 dex, Pustilnik et al. 2005; Izotov & Thuan 2007; Annibali et al. 2019) was recently presented in Pustilnik et al. (2024b), Pustilnik & Perepelitsyna (2025).
Another type of evolved massive star can show up in a V versus (V − I) diagram as a ‘blue outlier’ (e.g. Lorenzo et al. 2022). Such a star has MV ∼ −3.5 to −5 mag and colours bluer than the blue edge of the Main Sequence stars (namely, (V − I)∼ − 0.32; Lorenzo et al. 2025), and they can be helium burning WO stars with a surface temperature of up to 150–200 kK (Lorenzo et al. 2022, and references therein).
4.3. Properties of Peekaboo’s H II regions
In Appendix B of the appendix, we present the distribution of Hα flux along the slit, which looks similar to two close Gaussians with FWHMs of ∼3.4 and 3.7 arcsec, respectively. Their sizes along the slit (corrected for a seeing of ∼1.5 arcsec) are FWHM ∼3.05 and 3.4 arcsec, or ∼116 pc and 128 pc. In the colour HST image, one does not see such clear extended structures. These sizes probably represent the extent of the (smoothed due to seeing) collection of several smaller H II regions elongated along the galaxy major axis. Several of the smaller brightest H II regions are marked in Fig. A.1, and their parameters are summarised in Table E.2.
As the two-component velocity profiles of all emission lines in the E H II region evidence, this cell of ionised gas indeed has a complex origin. Roughly 30% of its nebular emission is related to the ionised gas, moving with a radial velocity of about −60 km s−1 (‘blue’ component hereafter) relative to the main body, which has a system velocity of Vhelio,H I = 716 km s−1 (Karachentsev et al. 2023). The radial velocities of the E region’s more massive ‘red’ velocity component and that of the W H II region are close to the system one.
The ionised gas of the ‘blue’ component should be connected with a fast-moving hot star. Such massive stars, which are products of co-evolution in binary systems, are well known in the Galaxy. Due to the ‘poor’ spatial resolution of the long-slit spectra, the size of the ‘blue’ component cannot be addressed directly. However, since the ‘blue’ component gas moves together with its exciting massive star, one can suggest that this shell is related to the mass loss from the fast-moving star that occurred after the epoch when it was thrown out from a close binary (or a cluster). The abundance pattern in E(blue), similar to those in the other regions, indicates that its nebular emission originates in the swept-up ambient gas shell. The case of the complex nature of the E H II region partly resembles the case of the H II region A2 in IC4662. In this region, the echelle spectroscopy revealed three components, and one of them is related to a known WR star and moves with a relative velocity of δV ∼ 20 km s−1 (Kniazev 2025).
In the appendix (Appendix B), we estimate the luminosities of the line Hβ of the three emission-line subsystems. Respectively, they are 7.5, 8.4, and 14.8 × 1036 erg s−1 for the W, E(blue), and E(red) subsystems. These luminosities can be used to estimate the conditional number of hot stars ionising these regions. For further calculations, we adopted the relation between L(Hβ) and the related flux of ionising quanta Q0: L(Hβ) = 4.76 × 10⁻¹³ Q0. The resulting values of Q0 for the three subsystems are as follows: (1.6, 1.8, and 3.2) 1049 phot s−1. Recently, Telford et al. (2023) estimated the value of Q0 for the lowest accessible metallicity O7V star LP26 in Leo P (12 + log(O/H) = 7.17 dex). This number, (3.74 ± 0.67) × 1048 phot s−1, is ∼2.5 times lower than the value usually adopted for the O7V star with Z= Z⊙. That is, we need from three to six O7V XMP stars per subsystem to provide the required amount of ionising photons.
Comparison of the star positions (marked with their numbers) in the HST image (top panel of Fig. A.1) and their positions in the diagram of Fig. E.1 revealed within the borders of the E region only one certain luminous O star (No. 7) and about 1-mag fainter probable O stars (No. 5 and No. 6). Besides, two likely luminous WR stars (No. 2 and No. 4) reside in the middle of the E region. One candidate very hot WR star, No. 1, is close to No. 2. In particular, their extremely blue V − I colours are consistent with those of WO stars, for which their temperatures are estimated to be in the range 150–210 kK (e.g. Tramper et al. 2015). Their parameter Q0 falls in the range of (0.8–3) × 1049 phot s−1. That is, even one such WO star is sufficient to provide ionising photons for each of the three H II subsystems.
Since observations indicate that most WR stars are situated on the edges of the related H II regions (e.g. Crowther & Bibby 2009), this implies that they were ejected from their parent cluster. Therefore, one can expect that the ‘fast-moving’ ‘blue’ subsystem of the E region is related to one of the above WR stars. The spectra of this region with a seeing of ≲0.5 arcsec could help disentangle various subsystems within this region.
Apart from these two elongated E and W complexes, numerous small blue non-stellar objects (‘nebulosities’) are distributed along the whole dwarf body. Their typical sizes of 0.2–0.5 arcsec correspond to linear sizes of 7–15 pc, or to Strömgren radii of ∼4–8 pc. Such small H II regions are probably ionised and excited by individual hot massive stars. Their (V − I) colours are bluer than those of hot O-type stars. Such very blue (V − I) colours were predicted for the nebular emission in low-metallicity high-temperature H II regions in Zackrisson et al. (2001), Anders & Fritze-v Alvensleben (2003). In particular, Anders & Fritze-v Alvensleben (2003) showed that the colour (V − I) for young starbursts with Z∼ Z⊙/50 can vary in the range of –0.7 to –0.25 mag for ages from 5 to 15 Myr due to the very strong contribution of emission lines in the V-band. This is exactly the range we observed for the five regions N1–N5 shown in Fig. E.1 and in Table E.2. As the lowest metallicity individual H II regions in the nearby Universe, these objects deserve spectroscopy with HST and/or ELTs.
5. Conclusions
The goals of this work was to improve the accuracy of Peekaboo’s gas metallicity and to address properties of its massive stars. Based on the new data, we have presented on the dwarf galaxy Peekaboo and their discussion, we arrived at the following conclusions:
-
The new spectral data for the two H II regions of the Peekaboo dwarf allowed us to uncover three ionised gas systems. Two systems, E and W, are separated spatially by ∼4 arcsec between their centres (140 pc) approximately along the galaxy major axis. In the E H II region, we observed two ‘co-spatial’ kinematically separated gas systems with radial velocities of Vhel of 720 km s−1 and 654 km s−1 (‘red’ and ‘blue’ components).
-
Thanks to the improved S-to-N ratio in the principal faint line [OIII]λ4363 Å of the E region (red), we derived its O/H with the direct (Te) method: 12 + log(O/H) = 6.99 ± 0.06 dex. For the E(blue) subsystem and for the W H II region, the line [O III]λ4363 Å is undetected. Their O/H values, derived via the empirical ‘strong-line’ method, appear very close to that of the E(red) subsystem with (O/H)(Te). The Peekaboo galaxy is the lowest metallicity dwarf within the LV and its environs among galaxies with gas O/H derived via the direct method.
-
We also derived the abundances of other heavy elements X (Ne, Ar, N, S), and they are consistent with the average X/O typical of galaxies in the lowest metallicity range.
-
Using the EDD coordinates, magnitudes, and colours of individual stars in the body of the Peekaboo dwarf, we identified the hot massive stars (including candidate WO stars) tentatively ionising its H II regions as well as four supergiants in this galaxy. These supergiants, as the brightest and the lowest-metallicity evolved massive stars, are valuable targets for detailed studies with HST and the upcoming ELTs as well as for ground-based monitoring of their possible large-amplitude variability. Their colours and spectral features as well as their variability could be suitable data to confront them with predictions of the modern models of stellar evolution at Z ∼ 0.02 Z⊙.
Thus, the Peekaboo dwarf is among the most intriguing dwarf galaxies in the Local Volume, and as such, it warrants intensive, multi-method, in-depth study. Its properties – ranging from high-resolution HI gas morphology and kinematics, through compact star-forming regions, to the lowest-metallicity known massive stars revealed via resolved space-based photometry and spectroscopy – are expected to significantly advance our understanding of the first building blocks of the early Universe.
Acknowledgments
Spectral observations reported in this paper were obtained with the Southern African Large Telescope (SALT) programs 2021-1-MLT-001 and 2023-1-MLT-006. A. K. acknowledges support from the National Research Foundation (NRF) of South Africa. The study was conducted under the state assignment of Lomonosov Moscow State University. The work was also performed as part of the SAO RAS government contract by the Ministry of Science and Higher Education of the Russian Federation. We acknowledge comments and suggestions of the anonymous referee, which helped to improve the paper clarity. This work is based on observations made with the NASA/ESA HST on the program SNAP 15992, PI R.B. Tully. We acknowledge the use of the Extragalactic Distance Database and, in particular, its CMDs/TRGB part. This work has made use of data from the Legacy Survey (DR10). The Legacy Survey team is acknowledged for making their data products available to the scientific community.
References
- Anand, G. S., Rizzi, L., Tully, R. B., et al. 2021, AJ, 162, 80 [CrossRef] [Google Scholar]
- Anders, P., & Fritze-v Alvensleben, U. 2003, A&A, 401, 1063 [NASA ADS] [CrossRef] [EDP Sciences] [Google Scholar]
- Annibali, F., La Torre, V., Tosi, M., et al. 2019, MNRAS, 482, 3892 [NASA ADS] [CrossRef] [Google Scholar]
- Buckley, D. A. H., Swart, G. P., & Meiring, J. G. 2006, SPIE, 6267, 32 [Google Scholar]
- Burgh, E. B., Nordsieck, K. H., Kobulnicky, H. A., et al. 2003, SPIE, 4841, 1463 [Google Scholar]
- Crawford, S. M., Still, M., Schellart, P., et al. 2010, in Observatory Operations: Strategies, Processes, and Systems III, eds. D. R. Silva, A. B. Peck, & B. T. Soifer, (Bellingham: SPIE), Proc. SPIE Conf. Ser., 7737, 773725 [NASA ADS] [CrossRef] [Google Scholar]
- Crowther, P. A., & Bibby, J. L. 2009, A&A, 499, 455 [NASA ADS] [CrossRef] [EDP Sciences] [Google Scholar]
- Eldridge, J. J., & Stanway, E. E. 2022, ARA&A, 60, 455 [NASA ADS] [CrossRef] [Google Scholar]
- Garcia, M., Evans, C. J., Bestenlehner, J. M., et al. 2021, Exp. Astron., 51, 887 [NASA ADS] [CrossRef] [Google Scholar]
- Gull, M., Weisz, D. R., Senchyna, P., et al. 2022, ApJ, 941, 206 [NASA ADS] [CrossRef] [Google Scholar]
- Izotov, Y. I., & Thuan, T. X. 2007, ApJ, 665, 1115 [NASA ADS] [CrossRef] [Google Scholar]
- Izotov, Y. I., Stasińska, G., Meynet, G., et al. 2006, A&A, 448, 955 [CrossRef] [EDP Sciences] [Google Scholar]
- Izotov, Y. I., Thuan, T. X., & Guseva, N. G. 2007, ApJ, 671, 1297 [NASA ADS] [CrossRef] [Google Scholar]
- Izotov, Y. I., Thuan, T. X., & Guseva, N. G. 2012, A&A, 546, A122 [NASA ADS] [CrossRef] [EDP Sciences] [Google Scholar]
- Izotov, Y. I., Guseva, N. G., Frieke, K. J., & Henkel, C. 2019, A&A, 523, A40 [Google Scholar]
- Karachentsev, I. D., Makarova, L. N., Koribalski, B. S., et al. 2023, MNRAS, 518, 5893 [Google Scholar]
- Kniazev, A. Y. 2022, Astrophys. Bull., 77, 334 [Google Scholar]
- Kniazev, A. Y. 2025, RAA, 25, 045012 [Google Scholar]
- Kniazev, A. Y., Zijlstra, A. A., Grebel, E. K., et al. 2008, MNRAS, 388, 1667 [CrossRef] [Google Scholar]
- Kobulnicky, H. A., Nordsieck, K. H., Burgh, E. B., et al. 2003, SPIE, 4841, 1634 [NASA ADS] [Google Scholar]
- Koribalski, B. S., Wang, J., Kamphius, P., et al. 2018, MNRAS, 478, 1611 [NASA ADS] [CrossRef] [Google Scholar]
- Li, C., Zhang, Y., Cui, C., et al. 2024, AJ, 168, 233 [Google Scholar]
- Lorenzo, M., Garcia, M., Najarro, F., et al. 2022, MNRAS, 516, 4164 [NASA ADS] [CrossRef] [Google Scholar]
- Lorenzo, M., Garcia, M., Castro, N., et al. 2025, MNRAS, 537, 1197 [Google Scholar]
- Lupton, R. 2005, https://www.sdss3.org/dr8/algorithms/sdssUBVRITransform.php#Lupton2005 [Google Scholar]
- Luridiana, V., Morisset, C., & Shaw, R. A. 2015, A&A, 573, A42 [NASA ADS] [CrossRef] [EDP Sciences] [Google Scholar]
- McQuinn, K. B. W., Skillman, E. D., Dalcanton, J. J., et al. 2012, ApJ, 759, 77 [Google Scholar]
- O’Donoghue, D., Buckley, D. A. H., Balona, L. A., et al. 2006, MNRAS, 372, 1510 [Google Scholar]
- Pustilnik, S. A., & Perepelitsyna, Y. A. 2025, A&A, 695, L7 [NASA ADS] [CrossRef] [EDP Sciences] [Google Scholar]
- Pustilnik, S., Kniazev, A., & Pramskij, A. 2005, A&A, 443, 91 [NASA ADS] [CrossRef] [EDP Sciences] [Google Scholar]
- Pustilnik, S. A., Tepliakova, A. L., Kniazev, A. Y., & Burenkov, A. N. 2010, MNRAS, 401, 333 [Google Scholar]
- Pustilnik, S. A., Tepliakova, A. L., & Makarov, D. I. 2019, MNRAS, 482, 4329 [NASA ADS] [CrossRef] [Google Scholar]
- Pustilnik, S. A., Egorova, E. S., Kniazev, A. Y., et al. 2021, MNRAS, 507, 494 [Google Scholar]
- Pustilnik, S. A., Kniazev, A. Y., Tepliakova, A. L., Perepelitsyna, Y. A., & Egorova, E. S. 2024a, MNRAS, 527, 11066 [Google Scholar]
- Pustilnik, S. A., Perepelitsyna, Y. A., Vinokurov, A. S., et al. 2024b, Astrophys. Bull., 79, 594 [NASA ADS] [CrossRef] [Google Scholar]
- Schlafly, E. F., & Finkbeiner, D. P. 2011, ApJ, 737, 103 [Google Scholar]
- Skillman, E., Salzer, J. J., Berg, D. A., et al. 2013, AJ, 146, 3 [CrossRef] [Google Scholar]
- Stasinska, G. 2005, A&A, 434, 507 [NASA ADS] [CrossRef] [EDP Sciences] [Google Scholar]
- Telford, O. G., McQuinn, K. B. W., Chisholm, J., & Berg, D. A. 2023, ApJ, 943, 65 [NASA ADS] [CrossRef] [Google Scholar]
- Telford, O. G., Chisholm, J., Sander, A. A. C., et al. 2024, ApJ, 974, 85 [NASA ADS] [Google Scholar]
- Tramper, F., Straal, S. M., Sanyal, D., et al. 2015, A&A, 581, A110 [NASA ADS] [CrossRef] [EDP Sciences] [Google Scholar]
- Tully, R. B., Rizzi, L., Shaya, E. J., et al. 2009, AJ, 138, 323 [NASA ADS] [CrossRef] [Google Scholar]
- Tweed, D. P., Mamon, G. A., Thuan, T. X., et al. 2018, MNRAS, 477, 1427 [Google Scholar]
- Zackrisson, E., Bergvall, N., Olofsson, K., & Siebert, A. 2001, A&A, 375, 814 [NASA ADS] [CrossRef] [EDP Sciences] [Google Scholar]
Appendix A: Hubble Space Telescope image of the Peekaboo dwarf with the slit position
In the top panel of Fig. A.1 we show the zoomed-in F606W HST image of the Peekaboo dwarf. The position of the 1.5-arcsec-width long slit is superimposed. We also overplot approximate boundaries of W and E H II regions with arcs, defined through the distance from the ’reference’ star. The hottest and supergiant stars are marked to show their location relative to W and E H II regions.
The bottom panel presents the same scale colour HST image of the galaxy. The brightest stars are visible along with numerous blue non-stellar objects (’nebulosities’) with the sizes of a fraction of arcsec. The respective linear extent is 8 to 15 pc. These are likely small H II regions, excited by individual massive hot stars. They are marked as N1–N7 in the top panel. Probably, the integrated nebular emission collected on the long slit, is just a sum of such smaller H II regions, which, due to the smoothing effect of seeing, show up only as emission of regions with sizes of ≲100 pc (≲3 arcsec).
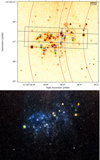 |
Fig. A.1. Top. Zoomed-in image of the Peekaboo dwarf in the F606W band from HST with the position of the 1.5-arcsec-width long slit superimposed (similar to that shown in Karachentsev et al. (2023)). We expanded the boundaries of the slit width by 0.7 arcsec to account for the light of the adjacent region which falls to the slit due to the seeing effect. Positions of the discussed hot and supergiant stars (Sect. E) are shown by the small circles with numbers, corresponding to the list in Table E.1. Bottom. Colour (V, I filters combined) image from HST of the Peekaboo dwarf with a similar scale and orientation as the top image. Numerous small (fraction of 1 arcsec) blue non-stellar objects (’nebulosities’) are seen, with the linear sizes of 7–15 pc. Due to the small sizes, they probably are related to singular massive stars. Seven of them are marked as N1–N7 in the top panel. Objects N1–N5 contribute to the emission in the slit. |
Appendix B: Two-dimensional spectra, sizes of H II regions, and related issues
In Fig. B.1 we present 2D spectra of Peekaboo with gratings PG900 and PG1800. Positions of E and W H II regions along the slit as well as that of the reference star are indicated. The reference star (RA,Dec = 172.8887,–31.6742) has the available photometry in Legacy DR10 release (Li et al. 2024) with the following magnitudes: g = 19.93, r = 19.49, i = 19.35, z = 19.31. We use this photometry and its 1D spectrum (we extract its full extent along the slit and estimate the loss on the slit of 24%) to produce the flux-calibrated spectra of the E and W regions and to estimate fluxes in Hβ lines. They, in turn, are used to estimate luminosities in this lines and the related parameters of exciting hot stars in these regions.
The fluxes of emission Hβ line of W and E regions are 8.5 and 26.3, respectively (in units of 10−16 erg cm−2 s−1). The line flux for the E region comprises two components, with the ’blue’ component part of 9.6 and the ’red’ component of 16.7. The related line luminosities, after correction for the measured extinction in the H II regions, C(Hβ)∼0.18 dex, or factor of 1.6, are as follows. For the W region, it is 7.5×1036, and for the E region, it is 23.2×1036 erg s−1, with the division of (8.4 and 14.8)×1036 for the blue and red components, respectively.
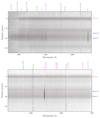 |
Fig. B.1. Two-dimensional low-resolution spectra of the Peekaboo galaxy obtained with grating PG900 (top) and PG1800 (bottom). The logarithmic scale of intensities was used. Negative offsets are east of the reference star. The most prominent emission lines are indicated as well as CCD gaps and night sky lines. |
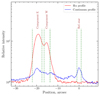 |
Fig. B.2. Brightness distribution in the line Hα along the slit and the cuts, adopted to extract individual spectra of the W and E regions. The estimated FWHM sizes are ∼2.0, 3.7 and 3.4 arcsec for the reference star, and for W and E components, respectively. After correcting for the seeing of 1.5 arcsec, their intrinsic FWHMs are ∼3.0 and 3.4 arcsec. |
Appendix C: Extracted one-dimensional spectra of the E and W H II regions
In Figure C.1 we show 1D spectra of Peekaboo’s E and W regions with grism PG900, in which we mark the main emission lines used for the abundance determination (Hydrogen Balmer lines and lines of O, Ne, N, S, Ar ions). The spectra are flux-calibrated via the known Legacy DR10 photometry of the reference star. In Figure C.2, a similar 1D spectrum is shown, with the higher spectral resolution with the use of grism PG3000. The faint auroral line [O III]λ4363 Å is well seen near Hγ in the spectrum of the eastern H II region.
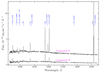 |
Fig. C.1. Extracted 1D spectra of E and W H II regions for grism PG900. Spectrum of region E is shifted up by 1.0 unit for the better view. The most prominent emission lines are indicated. |
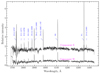 |
Fig. C.2. Extracted 1D spectra of Peekaboo’s E and W H II regions for grism PG3000. Spectrum of region E is shifted by δy= +0.9 for the better view. The most prominent emission lines are indicated. |
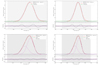 |
Fig. C.3. Examples of one- and two-Gaussian fits of the emission lines Hβ and [OIII]λ5007 in the spectrum of the E H II region. The substantially reduced residual signal for the two-gauss fit is quantitatively described by the decreased several times the reduced χ2 statistic. See Sect. 3.1. |
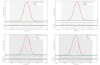 |
Fig. C.4. Examples of one- and two-Gaussian fits of the emission lines Hδ and Hγ observed with grating PG3000 in the spectrum of the E H II region. The reduced χ2 statistic decreases by the factors of approximately three and two, respectively. |
Appendix D: Line intensities and element abundances in the E and W H II regions of the Peekaboo dwarf
In Table D.1 we present the measured relative line fluxes F(λ) and corrected for extinction and underlying Balmer absorptions relative line intensities I(λ) for the three subsystems described in Sect. 2.1 and 3.1. All details of line measurements and the subsequent determination of physical conditions and element abundances are described in Kniazev et al. (2008). The relevant collision strengths and transition probabilities were used from Stasinska (2005) and Izotov et al. (2006). The results of the abundance calculations, obtained using these programmes, were compared with those derived from the PyNeb package (Luridiana et al. 2015). The comparison demonstrates consistency within the stated uncertainties.
In the bottom of Table D.1 we also present the derived extinction coefficient C(Hβ), equivalent widths of Balmer absorptions EW(abs) in the underlying continuum and the equivalent widths of emission line Hβ EW(Hβ). These corrected line intensities I(λ) are used for calculations of physical conditions and element abundances according to recipes from Izotov et al. (2006). The standard two-zone model is assumed with the internal hot zone, where oxygen is twice-ionised, and the outer colder zone, where oxygen is single-ionised. In Table D.2, for the same three subsystems, we present Te for those two zones, and the estimate of electron density via the ratio of line fluxes in [SII] doublet. Since for all three subsystems, this ratio exceeds the theoretical limit of 1.43, corresponding to the limit of the low density (1 cm−3), we adopt for all cases the conditional value of ne = 10 cm−3, typical of majority of extragalactic H II regions. The uncertainties of Te are calculated according to Equation 3 from Kniazev et al. (2008) via the standard error transfer from the known uncertainties of the related fluxes of the Oxygen lines. The temperatures Te(O[II]) and Te(S[III]) are calculated using the approximation from Izotov et al. (2006).
The abundances of oxygen and other elements are derived with the direct method when the faint auroral line [O III]λ4363 is available. When this line is below the noise level (as in the subsystems of E(blue) and Region W), we obtain the estimate of O/H with the modified semi-empirical method (mse) (suggested in Izotov & Thuan (2007) and modified with the account for effect of parameter O32, in Pustilnik et al. 2021). For the independent estimate of 12+log(O/H), we apply also the strong-line method of Izotov et al. (2019), which appears to demonstrate the best accuracy among all known empirical estimators. In particular, the independent check of its accuracy on the extended sample of the low-metallicity H II regions in Pustilnik et al. (2021), resulted in its internal rms scatter of only 0.04 dex. As one can see, the estimates of O/H with the three different methods for these H II regions give very close results.
The obtained abundance ratios of N/O, S/O, Ne/O, Ar/O in all three subsystems are consistent to each other. We can calculate their weighted averages as the characteristic values of the whole Peekaboo galaxy. The results are as follows: log(N/O) = –1.45±0.03, log(Ne/O) = –0.87±0.05; log(S/O) = -1.72±0.07, log(Ar/O) = –2.33±0.09. These averages are well consistent with the abundances ratios for the lowest metallicities, compiled by Izotov et al. (2006, in their Figure 10, left panel).
Line intensities in the three subsystems of Peekaboo.
Abundances in three components of Peekaboo.
Appendix E: HST data: Identification of the XMP massive hot stars and supergiants
We plot in Fig. E.1 positions of all HST stars within the Peekaboo body in the diagram MV versus colour (V−I)0. We mark by their numbers from Table E.1 all ’blue’ hot stars and the four supergiants with MV< –6.0 mag. Here, for both MV and (V−I)0, only extinction in the Galaxy is accounted for, corresponding to E(B-V) = 0.062 (Schlafly & Finkbeiner 2011), and the related AV = 0.186 mag and E(V − I) = 0.066 mag. As one can see in the bottom of Table D.1, C(Hβ) for all three systems is the same within rather small uncertainties. We adopt its average value of 0.17. Then, for stars residing within the borders of these H II regions, one can expect the elevated extinction and reddening, in addition to the adopted Milky Way values, δAV = 0.16 mag and δE(V − I) = 0.057 mag. In fact, we do not know how this extinction is distributed within the E and W regions. If it is localised within the ’blue nebulosities’, then this ’reddening’ correction is probably applicable only to stars residing close to these ’blue nebulosities’.
Therefore, looking at the marked positions of blue and bluish stars in the Peekaboo dwarf image in Fig. A.1 (top), one can understand where these stars shift in Fig. E.1 with the account of the additional extinction (its value is shown by the "arrow" in the plot). Curiously, but no stellar objects are identified within the W region. At the same time, two very blue and rather luminous ’nebulosities’, N4 and N5 can be the main contributors to the visible nebular emission of the W H II region. As for the E H II region, there are several stars, for which the additional extinction can take place. These are stars No. 1, 2, 4, 5, 6, 7, 8. Stars No. 10, 15, 18 and 20 reside in the ’narrow’ layer between the E and W H II regions and also can be affected by the additional extinction. So, for some of the discussed blue stars, their colour index (V − I) can be bluer than that shown in Fig. E.1. This implies that some of visible hot stars within the E region can shift after the colour correction to the area of ’blue outliers’, where the very hot helium burning stars similar to WO stars reside (Lorenzo et al. 2022).
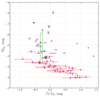 |
Fig. E.1. Hubble Space Telescope-based diagram of ’MV versus (V − I)’, corrected for MW extinction, for all stars within the Peekaboo dwarf body. Several the hottest stars ((V−I)0 < –0.25 mag) and four supergiant stars (MV, 0< –6.0 mag) are marked by their numbers in Tab. E.1. The additional extinction of δAV = 0.16 mag and reddening of δ(V − I) = 0.057 mag in the E and W H II-regions (estimated above in this section) is not taken into account in the plot. Its effect is shown by an arrow in the upper-left section of the plot. Stars No. 1, 2 and 3 show very blue (V−I)0 of –0.88 and ∼–0.60. Despite rather large errors σ(V − I), they are much bluer of the border of the main sequence at (V–I) of the hottest OV-stars of –0.32 mag (Lorenzo et al. 2025). These ’blue outliers’ can be very hot evolved stars, with the surface temperatures up to 150–200 kK as suggested by Lorenzo et al. (2022) for several such stars in the galaxy Sextans A. We plot also positions of 5 ’nebulosities’ (N1–N5) within the borders of W and E H II regions, which are marked by circles in Fig. A.1 (top panel). |
Magnitudes and colours of the HST stars within the Peekaboo dwarf body, partly adopted from the EDD table.
Magnitudes and colours of the HST brightest H II regions within the Peekaboo body.
General properties of known XMP galaxies within the LV.
All Tables
Magnitudes and colours of the HST stars within the Peekaboo dwarf body, partly adopted from the EDD table.
Magnitudes and colours of the HST brightest H II regions within the Peekaboo body.
All Figures
|
Fig. A.1. Top. Zoomed-in image of the Peekaboo dwarf in the F606W band from HST with the position of the 1.5-arcsec-width long slit superimposed (similar to that shown in Karachentsev et al. (2023)). We expanded the boundaries of the slit width by 0.7 arcsec to account for the light of the adjacent region which falls to the slit due to the seeing effect. Positions of the discussed hot and supergiant stars (Sect. E) are shown by the small circles with numbers, corresponding to the list in Table E.1. Bottom. Colour (V, I filters combined) image from HST of the Peekaboo dwarf with a similar scale and orientation as the top image. Numerous small (fraction of 1 arcsec) blue non-stellar objects (’nebulosities’) are seen, with the linear sizes of 7–15 pc. Due to the small sizes, they probably are related to singular massive stars. Seven of them are marked as N1–N7 in the top panel. Objects N1–N5 contribute to the emission in the slit. |
| In the text | |
|
Fig. B.1. Two-dimensional low-resolution spectra of the Peekaboo galaxy obtained with grating PG900 (top) and PG1800 (bottom). The logarithmic scale of intensities was used. Negative offsets are east of the reference star. The most prominent emission lines are indicated as well as CCD gaps and night sky lines. |
| In the text | |
|
Fig. B.2. Brightness distribution in the line Hα along the slit and the cuts, adopted to extract individual spectra of the W and E regions. The estimated FWHM sizes are ∼2.0, 3.7 and 3.4 arcsec for the reference star, and for W and E components, respectively. After correcting for the seeing of 1.5 arcsec, their intrinsic FWHMs are ∼3.0 and 3.4 arcsec. |
| In the text | |
|
Fig. C.1. Extracted 1D spectra of E and W H II regions for grism PG900. Spectrum of region E is shifted up by 1.0 unit for the better view. The most prominent emission lines are indicated. |
| In the text | |
|
Fig. C.2. Extracted 1D spectra of Peekaboo’s E and W H II regions for grism PG3000. Spectrum of region E is shifted by δy= +0.9 for the better view. The most prominent emission lines are indicated. |
| In the text | |
|
Fig. C.3. Examples of one- and two-Gaussian fits of the emission lines Hβ and [OIII]λ5007 in the spectrum of the E H II region. The substantially reduced residual signal for the two-gauss fit is quantitatively described by the decreased several times the reduced χ2 statistic. See Sect. 3.1. |
| In the text | |
|
Fig. C.4. Examples of one- and two-Gaussian fits of the emission lines Hδ and Hγ observed with grating PG3000 in the spectrum of the E H II region. The reduced χ2 statistic decreases by the factors of approximately three and two, respectively. |
| In the text | |
|
Fig. E.1. Hubble Space Telescope-based diagram of ’MV versus (V − I)’, corrected for MW extinction, for all stars within the Peekaboo dwarf body. Several the hottest stars ((V−I)0 < –0.25 mag) and four supergiant stars (MV, 0< –6.0 mag) are marked by their numbers in Tab. E.1. The additional extinction of δAV = 0.16 mag and reddening of δ(V − I) = 0.057 mag in the E and W H II-regions (estimated above in this section) is not taken into account in the plot. Its effect is shown by an arrow in the upper-left section of the plot. Stars No. 1, 2 and 3 show very blue (V−I)0 of –0.88 and ∼–0.60. Despite rather large errors σ(V − I), they are much bluer of the border of the main sequence at (V–I) of the hottest OV-stars of –0.32 mag (Lorenzo et al. 2025). These ’blue outliers’ can be very hot evolved stars, with the surface temperatures up to 150–200 kK as suggested by Lorenzo et al. (2022) for several such stars in the galaxy Sextans A. We plot also positions of 5 ’nebulosities’ (N1–N5) within the borders of W and E H II regions, which are marked by circles in Fig. A.1 (top panel). |
| In the text | |
Current usage metrics show cumulative count of Article Views (full-text article views including HTML views, PDF and ePub downloads, according to the available data) and Abstracts Views on Vision4Press platform.
Data correspond to usage on the plateform after 2015. The current usage metrics is available 48-96 hours after online publication and is updated daily on week days.
Initial download of the metrics may take a while.