Open Access
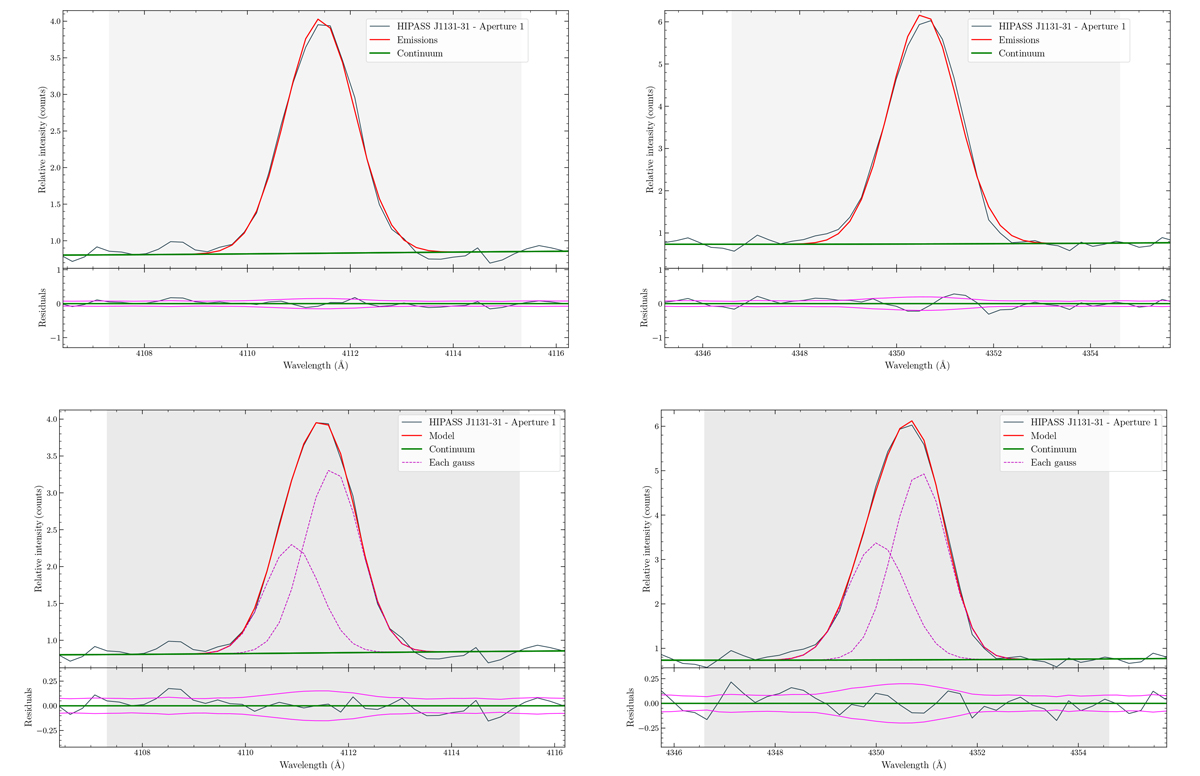
Fig. C.4.
Download original image
Examples of one- and two-Gaussian fits of the emission lines Hδ and Hγ observed with grating PG3000 in the spectrum of the E H II region. The reduced χ2 statistic decreases by the factors of approximately three and two, respectively.
Current usage metrics show cumulative count of Article Views (full-text article views including HTML views, PDF and ePub downloads, according to the available data) and Abstracts Views on Vision4Press platform.
Data correspond to usage on the plateform after 2015. The current usage metrics is available 48-96 hours after online publication and is updated daily on week days.
Initial download of the metrics may take a while.