Fig. 2.
Download original image
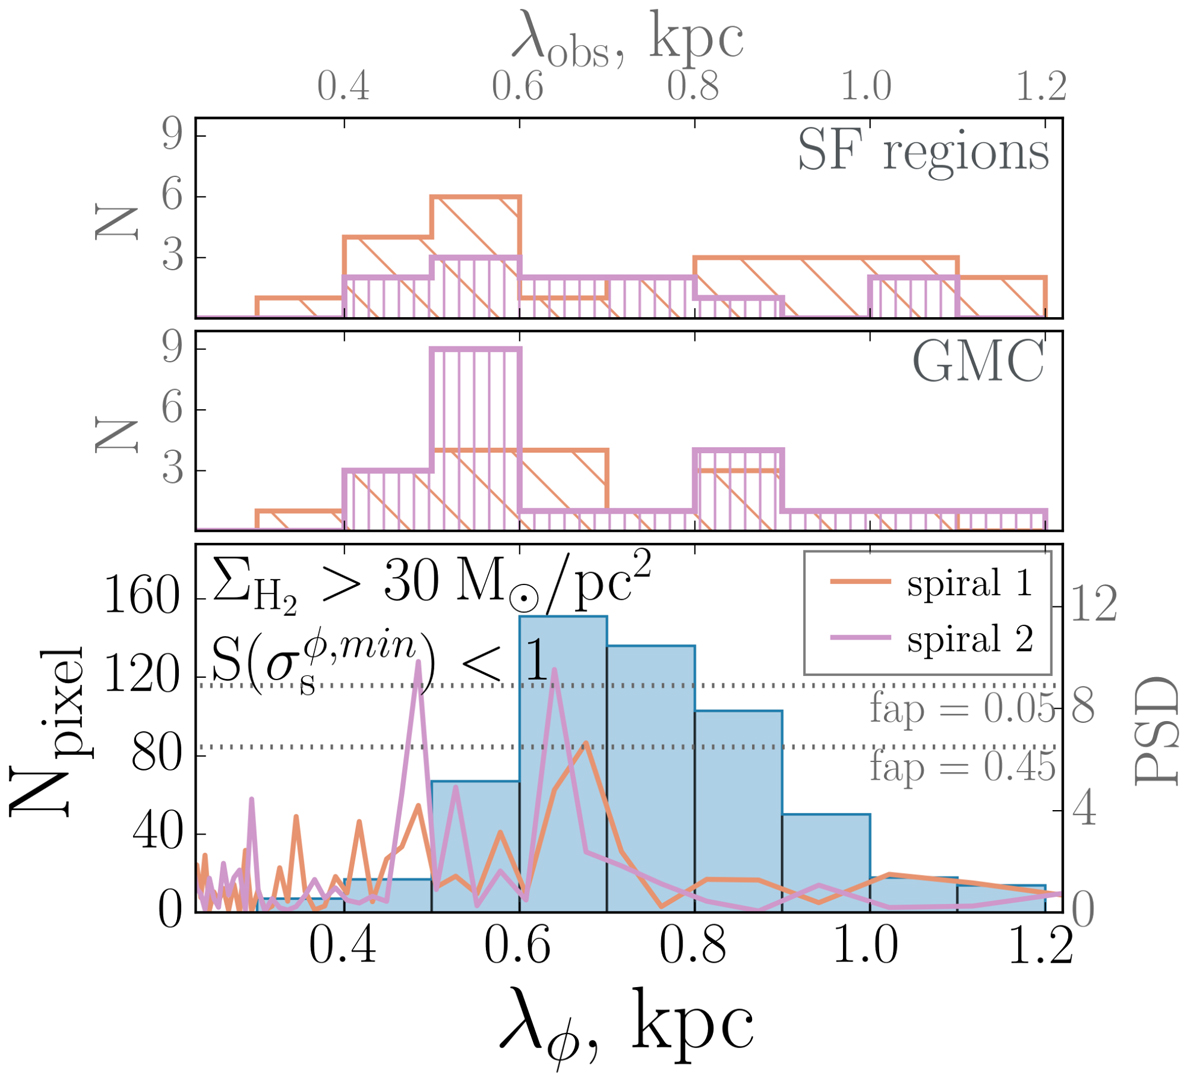
Top and middle panels: Histograms of the distance distributions between neighboring SF regions and giant molecular clouds for different spiral arms. Bottom panel: Distribution of instability wavelengths, which are shown on the right side of Fig. 1. The blue histogram includes only those pixels with both ΣH2 > 30 M⊙/pc2 and ![]() . Solid lines represent the Fourier analysis of the GMC spacings, its range of values is shown on the right y-axis.
. Solid lines represent the Fourier analysis of the GMC spacings, its range of values is shown on the right y-axis.
Current usage metrics show cumulative count of Article Views (full-text article views including HTML views, PDF and ePub downloads, according to the available data) and Abstracts Views on Vision4Press platform.
Data correspond to usage on the plateform after 2015. The current usage metrics is available 48-96 hours after online publication and is updated daily on week days.
Initial download of the metrics may take a while.