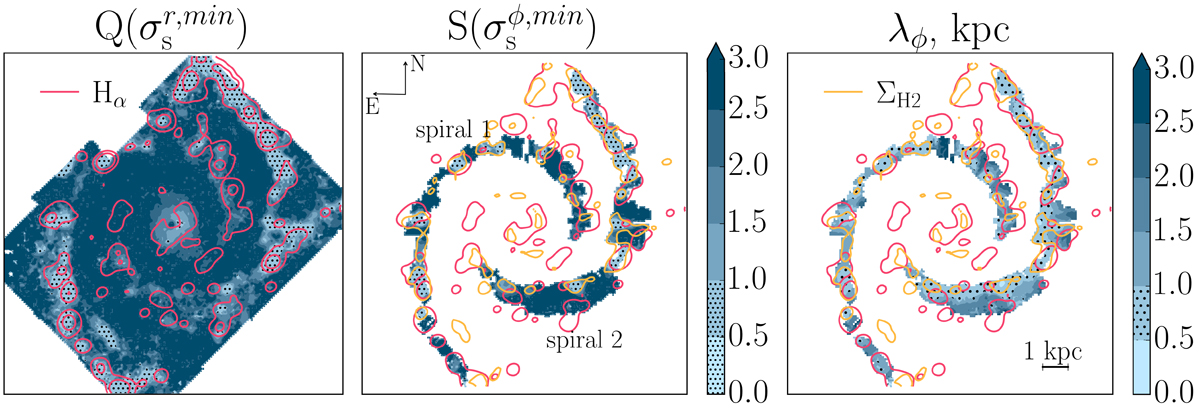
Fig. 1.
Download original image
Left and center panels: Maps of instability parameters related to radial (Q) and azimuthal (S) perturbations, calculated from the minimum value of the corresponding component of the stellar velocity dispersion. Right panel: Distribution of instability wavelengths relative to azimuthal perturbations, λϕ. The red contours on the left indicate isolines of Hα brightness, with values of logHα equal to −17.2 and −16.5 [erg/s/cm2]. Red and orange contours in the middle and right panels correspond to logHα = −17.2 [erg/s/cm2] and ΣH2 = 30 M⊙/pc2.
Current usage metrics show cumulative count of Article Views (full-text article views including HTML views, PDF and ePub downloads, according to the available data) and Abstracts Views on Vision4Press platform.
Data correspond to usage on the plateform after 2015. The current usage metrics is available 48-96 hours after online publication and is updated daily on week days.
Initial download of the metrics may take a while.