Fig. 3.
Download original image
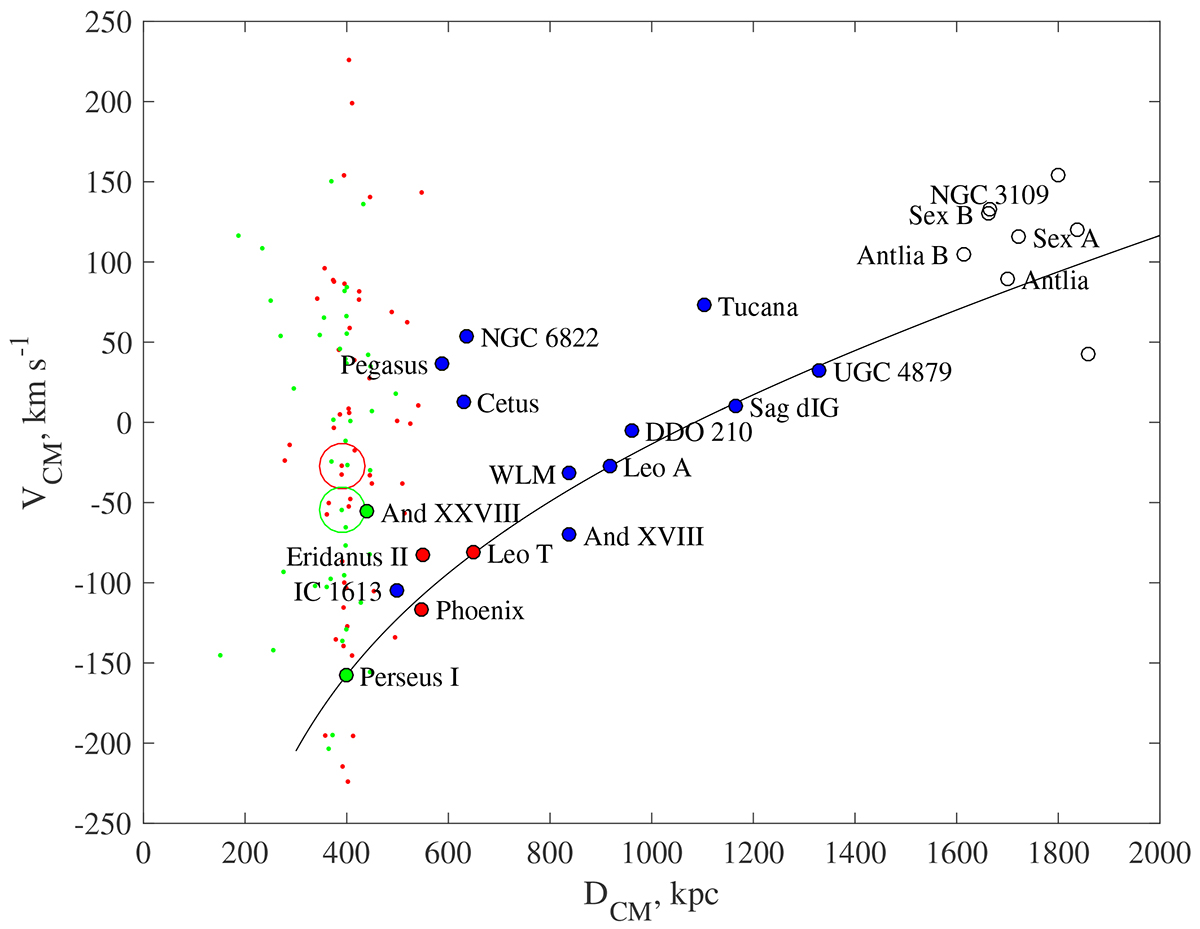
Hubble flow with respect to the Local Group center of mass. The big open red circle corresponds to the MW, the small red dots indicate its satellites inside 300 kpc, and the filled red circles represent the MW members at distances from 300 to 450 kpc. Likewise, M 31 and its satellites are shown in green. The galaxies selected for the analysis are shown in blue. The solid line corresponds to the Hubble flow model around a point mass of 2.5 × 10¹² M⊙.
Current usage metrics show cumulative count of Article Views (full-text article views including HTML views, PDF and ePub downloads, according to the available data) and Abstracts Views on Vision4Press platform.
Data correspond to usage on the plateform after 2015. The current usage metrics is available 48-96 hours after online publication and is updated daily on week days.
Initial download of the metrics may take a while.