Fig. 1.
Download original image
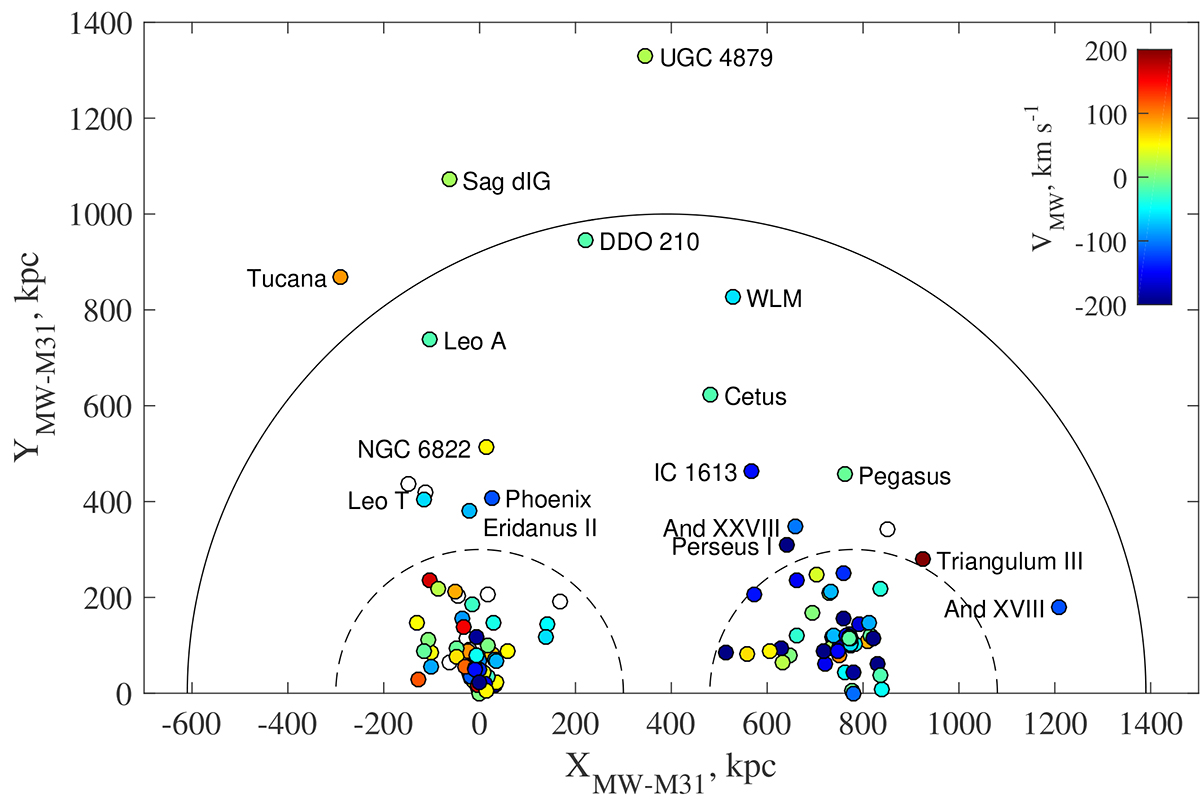
Distribution of Local Group galaxies in a cylindrical projection, where the X axis is directed from the center of the MW to the center of the M 31, and the Y axis corresponds to the distance from the X axis. The dashed semicircles with a radius of 300 kpc roughly correspond to the size of the virial zones around the two main galaxies. A solid semicircle with a radius of 1 Mpc shows the approximate boundary of the Local Group. Objects are colored according to their radial velocities relative to the center of our Galaxy. Open dots indicate dwarf galaxies with unknown velocities.
Current usage metrics show cumulative count of Article Views (full-text article views including HTML views, PDF and ePub downloads, according to the available data) and Abstracts Views on Vision4Press platform.
Data correspond to usage on the plateform after 2015. The current usage metrics is available 48-96 hours after online publication and is updated daily on week days.
Initial download of the metrics may take a while.