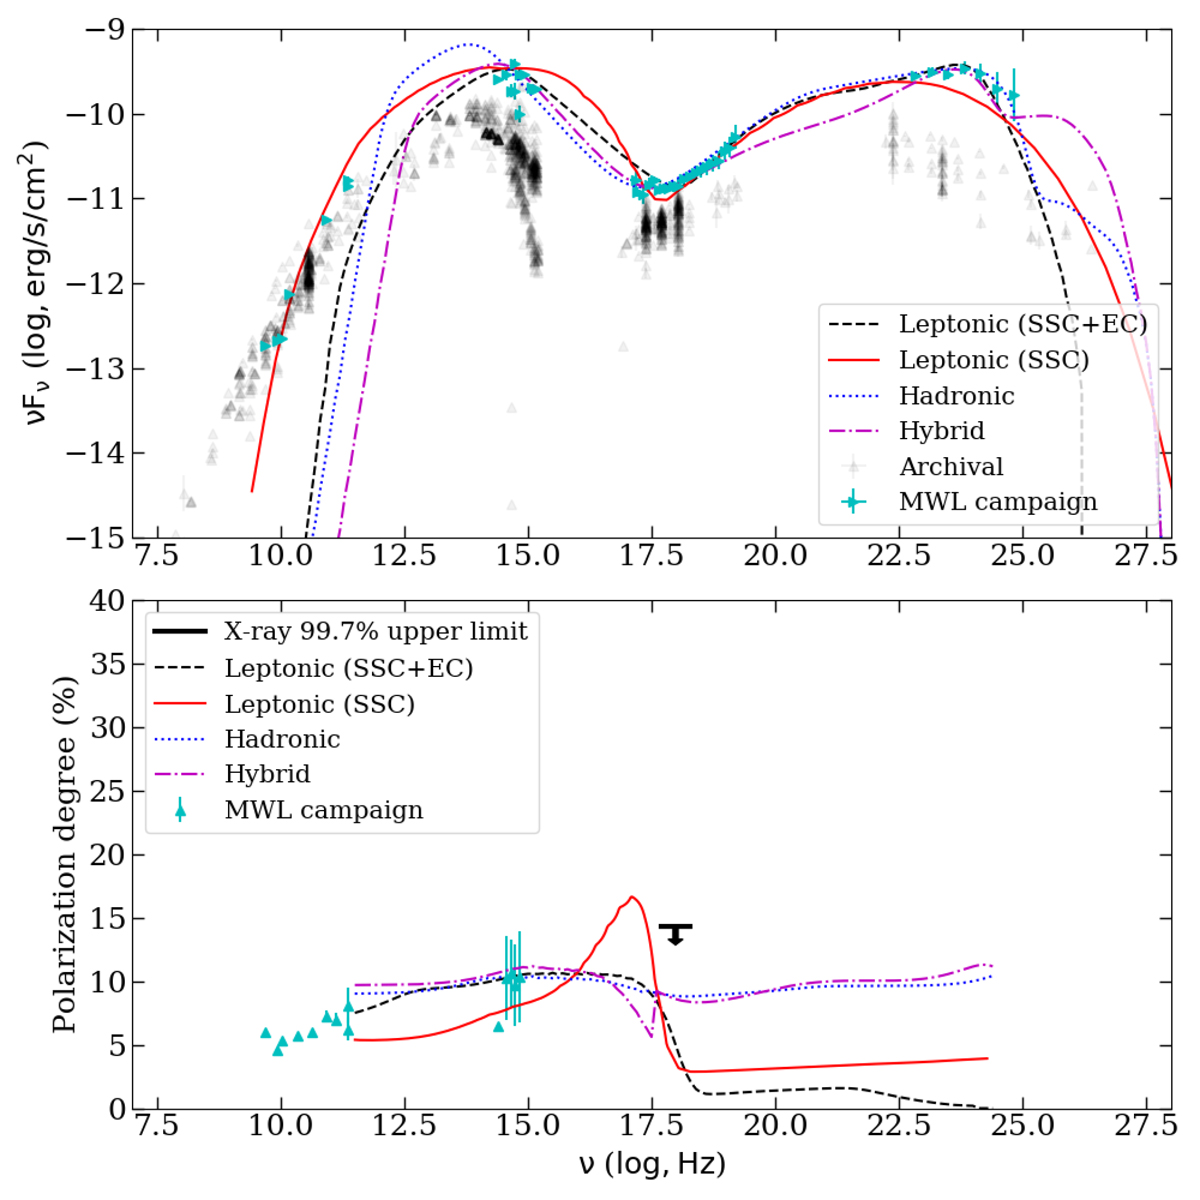
Fig. 1.
Download original image
Total intensity (top panel) and polarization (bottom panel) SED modeling for OBS3. The simultaneous observations from the MWL campaign are shown in cyan. The archival observations from the Space Science Data Center are shown in black. For both flux and polarization degree, we show the median and standard deviation in different frequencies within the IXPE observation. The lines corresponding to the different emission models are listed in the legend.
Current usage metrics show cumulative count of Article Views (full-text article views including HTML views, PDF and ePub downloads, according to the available data) and Abstracts Views on Vision4Press platform.
Data correspond to usage on the plateform after 2015. The current usage metrics is available 48-96 hours after online publication and is updated daily on week days.
Initial download of the metrics may take a while.