Fig. 8.
Download original image
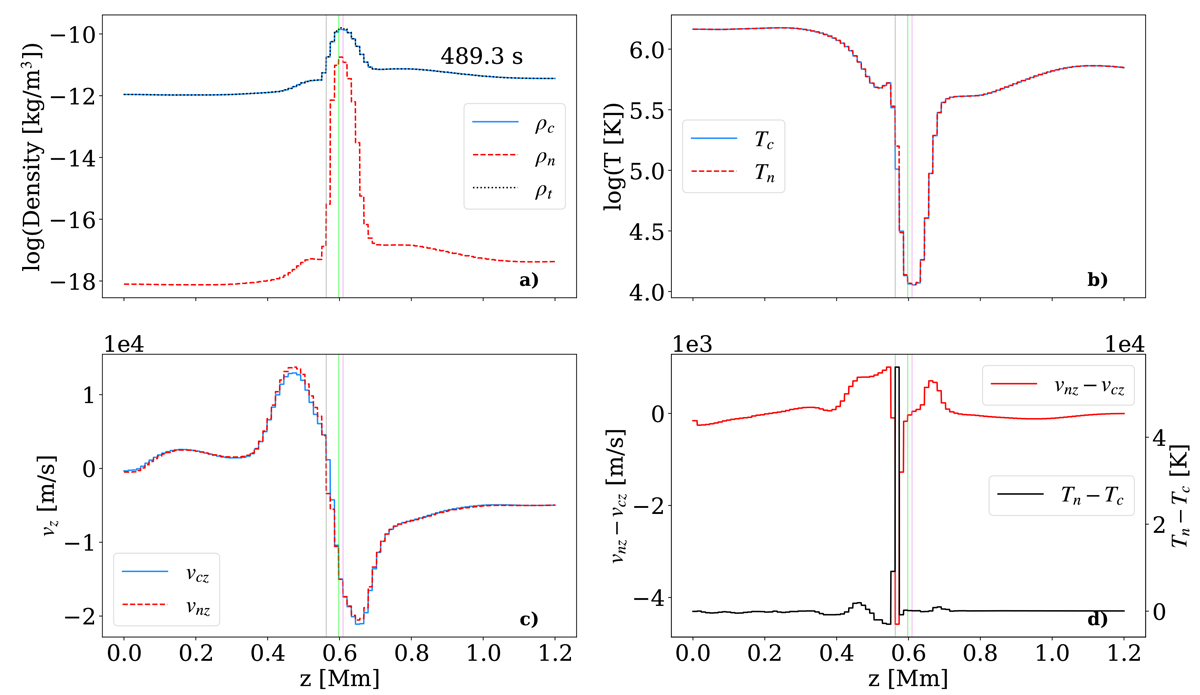
Quantities along a vertical line cut at x=−1.25 Mm, y=0 for z between 0 and 1.2 Mm at time t=489.3 s. (a) Densities of charges (solid blue line), neutrals (dashed red line), and total (dotted black line). (b) Temperature of charges (solid blue line) and neutrals (dashed red line). (c)Vertical velocity of charges (solid blue line) and neutrals (dashed red line). (d) Decoupling in velocity, vnz−vcz (red line on the left axis), and decoupling in temperature, Tn−Tc (black line on the right axis). The three thin vertical reference lines correspond to: maximum density for all the three densities plotted: charges, neutrals, and total (green), maximum decoupling in both velocity and temperature (gray), and minimum temperature for charges and neutrals (violet).
Current usage metrics show cumulative count of Article Views (full-text article views including HTML views, PDF and ePub downloads, according to the available data) and Abstracts Views on Vision4Press platform.
Data correspond to usage on the plateform after 2015. The current usage metrics is available 48-96 hours after online publication and is updated daily on week days.
Initial download of the metrics may take a while.