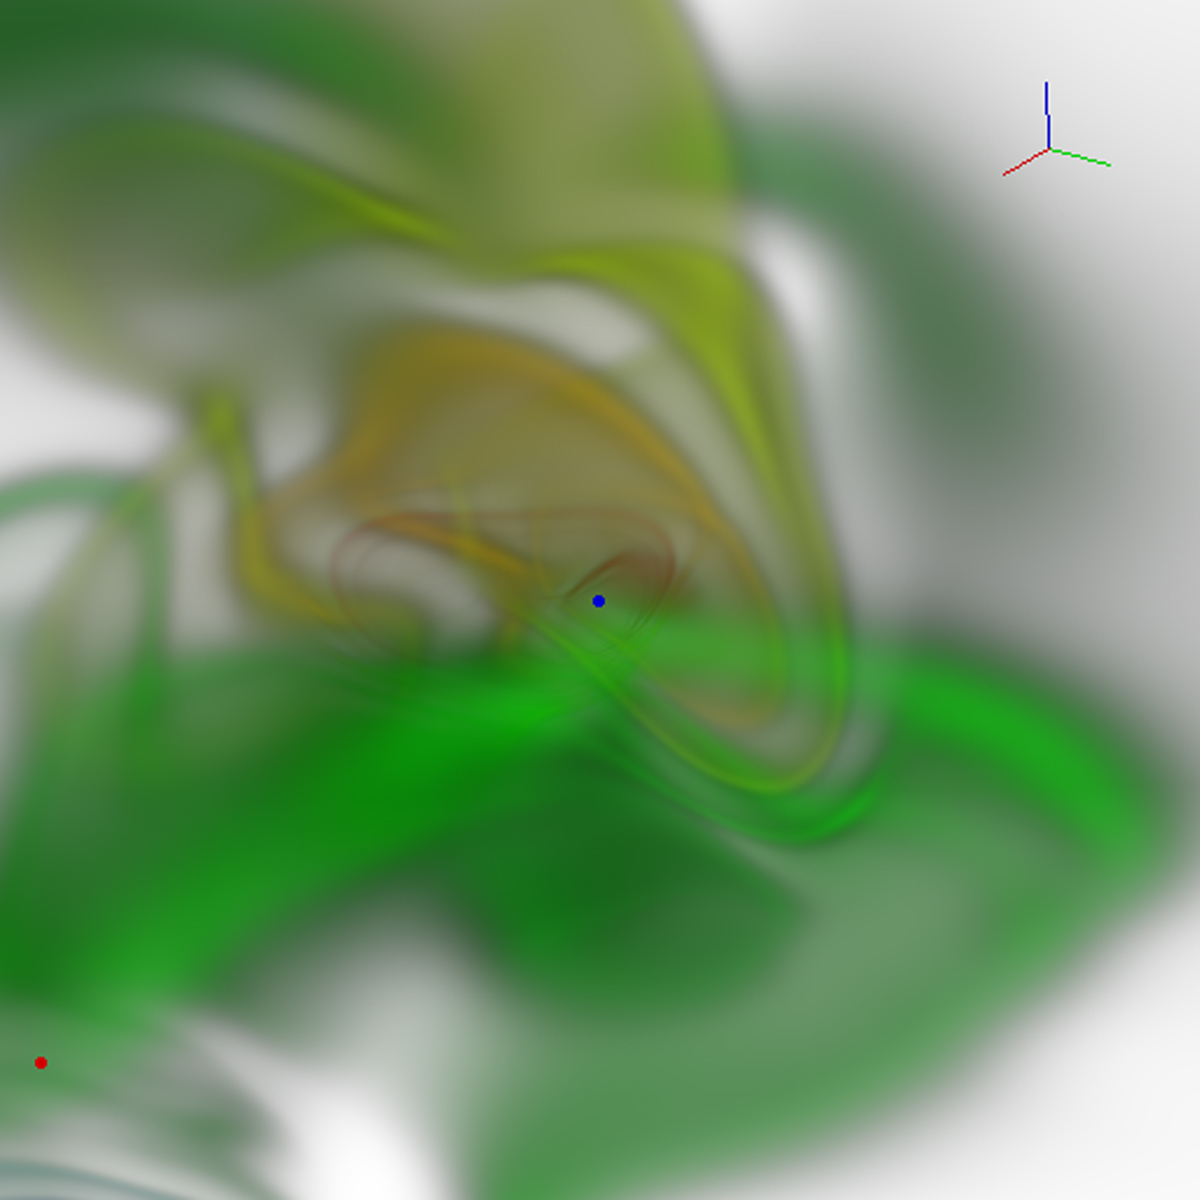
Fig. 7.
Download original image
3D integrated density of charges zoomed around the condensation point at time t=489.3 s, shown from a different angle than in Figure 6, as is indicated by the colored axes. The center of the condensation, located at (–1.25,0.0.6) Mm, is marked with a blue dot, and the perturbed null point is indicated by a red dot, consistent with Figures 3, 4, and 6.
Current usage metrics show cumulative count of Article Views (full-text article views including HTML views, PDF and ePub downloads, according to the available data) and Abstracts Views on Vision4Press platform.
Data correspond to usage on the plateform after 2015. The current usage metrics is available 48-96 hours after online publication and is updated daily on week days.
Initial download of the metrics may take a while.