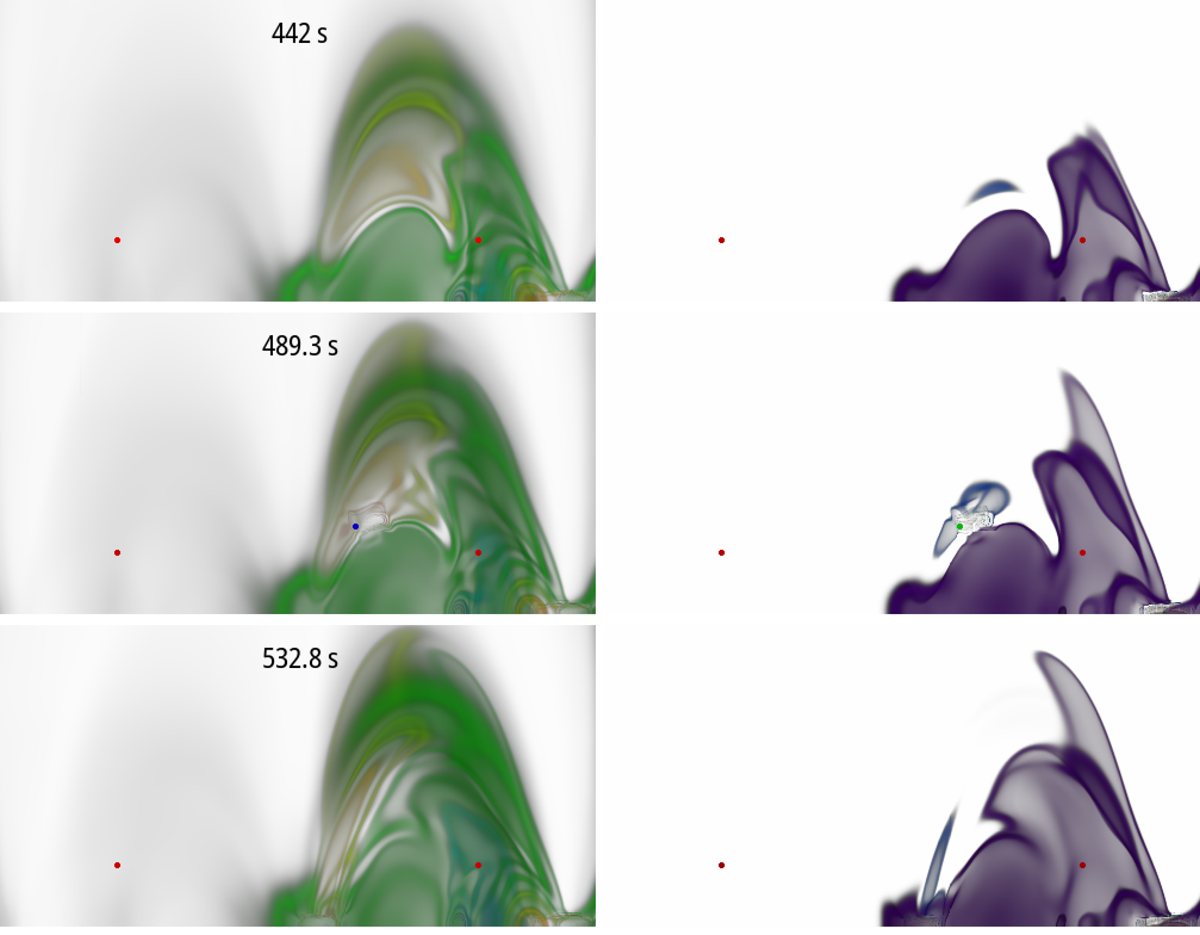
Fig. 6.
Download original image
Evolution of the density integrated along the y direction around the time of the simulation when a condensation appear in the simulation. Left: Density of charges. Right: Density of neutrals. The magnetic null points are highlighted with small red circles. The point located at (–1.25,0,0.6) Mm, along the high density structure in the plane y=0, is marked for reference with green and blue, the same points highlighted in Figures 3 and 4 above.
Current usage metrics show cumulative count of Article Views (full-text article views including HTML views, PDF and ePub downloads, according to the available data) and Abstracts Views on Vision4Press platform.
Data correspond to usage on the plateform after 2015. The current usage metrics is available 48-96 hours after online publication and is updated daily on week days.
Initial download of the metrics may take a while.