Fig. 5.
Download original image
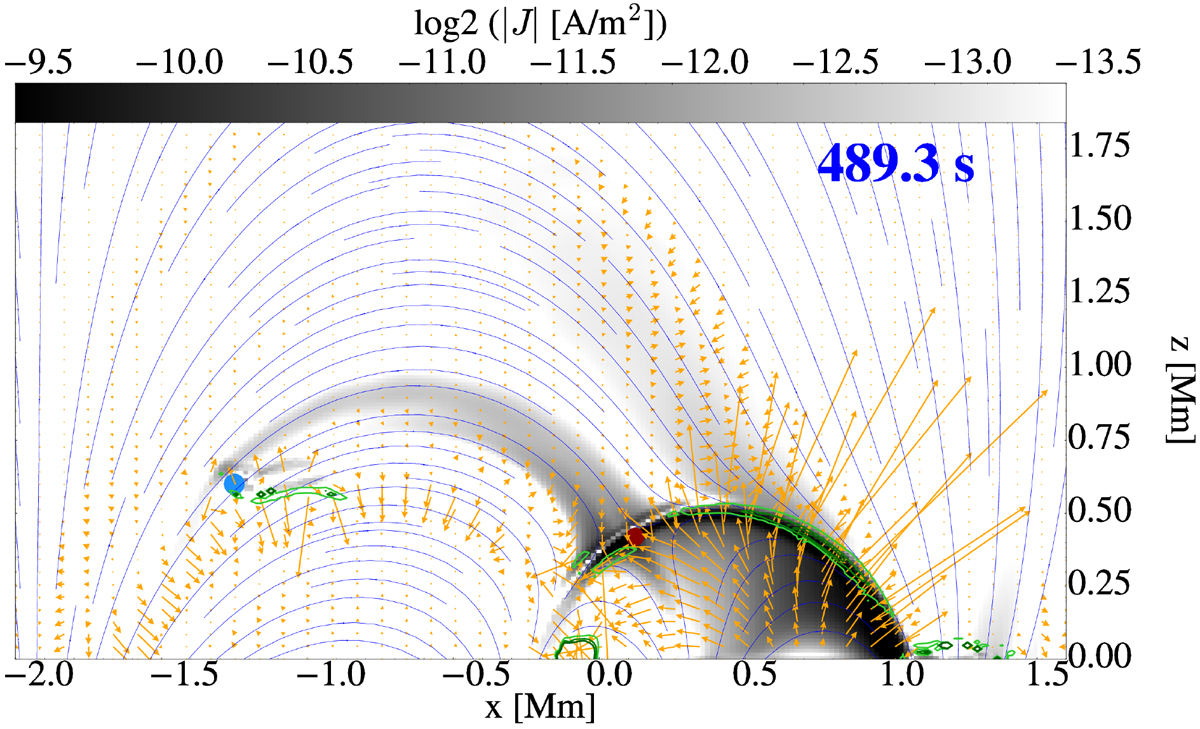
Slice at y=0 for the time t=489.3 s of the magnitude of the current density. The quantity plotted is the base 2 logarithm of |J|, and the limits of the color bar of –13.5 and –9.5 correspond to |J|=8.6×10⁻⁵ A/m2 and |J|=1.38×10⁻³ A/m2, respectively. The in-plane magnetic field lines are overplotted by blue lines and the orange arrows indicate the in-plane decoupling velocity, the projection in the xz plane of the quantity vn−vc. The perturbed null point is shown by a red dot. The isocontours of the decoupling in temperature, Tn−Tc, are shown by green lines, indicating three values of 10, 30, and 50 kK (darker green for a larger value).
Current usage metrics show cumulative count of Article Views (full-text article views including HTML views, PDF and ePub downloads, according to the available data) and Abstracts Views on Vision4Press platform.
Data correspond to usage on the plateform after 2015. The current usage metrics is available 48-96 hours after online publication and is updated daily on week days.
Initial download of the metrics may take a while.