Fig. 3.
Download original image
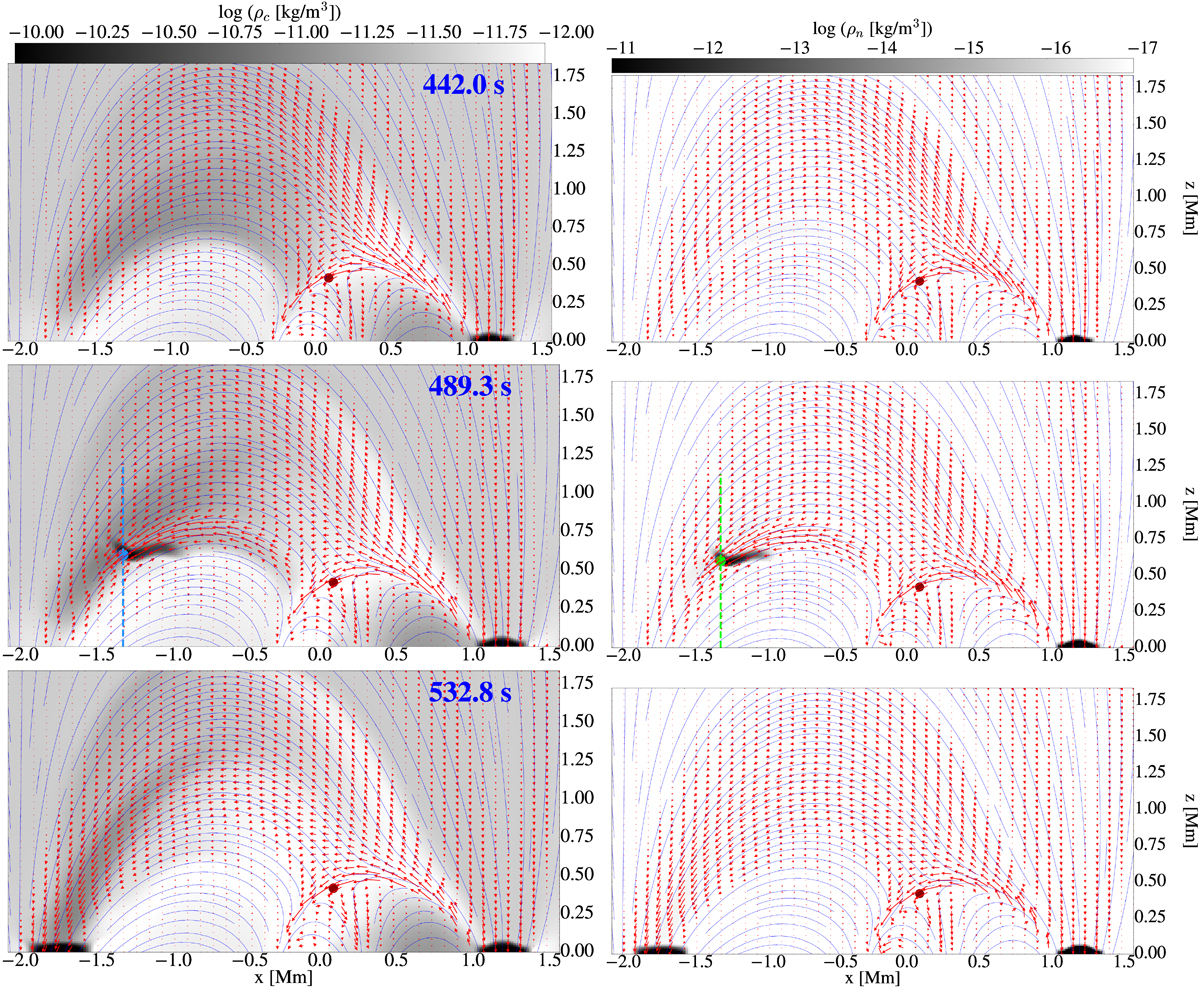
Slice at y=0 for the times t=442 s (top row), t=489.3 s (middle row), and t=532.8 s (bottom row), showing the formation and evolution of the rain blob. Left: Density of charges. The red arrows show the in-plane velocity of charges. Right: Density of neutrals. The red arrows show the in-plane velocity of neutrals. The in-plane magnetic field lines are overplotted by blue lines in all the panels. The perturbed null point is shown by a red dot, the other null point being outside the domain plotted in these panels. At the time t=489.3 s, when the blob is formed fully (middle row), the point with a high density, situated at x=−1.25 Mm and z=0.6 Mm, is marked in the charges and neutral density panels by a blue and green dot, respectively. This point is the same point marked in Figure 4 and Figure 6 below for the panels on the second row, for a better visualization. The line along the cut used in Figure 8 below is indicated by a dashed line: blue in the charge density panel and green in the neutral density panel.
Current usage metrics show cumulative count of Article Views (full-text article views including HTML views, PDF and ePub downloads, according to the available data) and Abstracts Views on Vision4Press platform.
Data correspond to usage on the plateform after 2015. The current usage metrics is available 48-96 hours after online publication and is updated daily on week days.
Initial download of the metrics may take a while.