Fig. 1.
Download original image
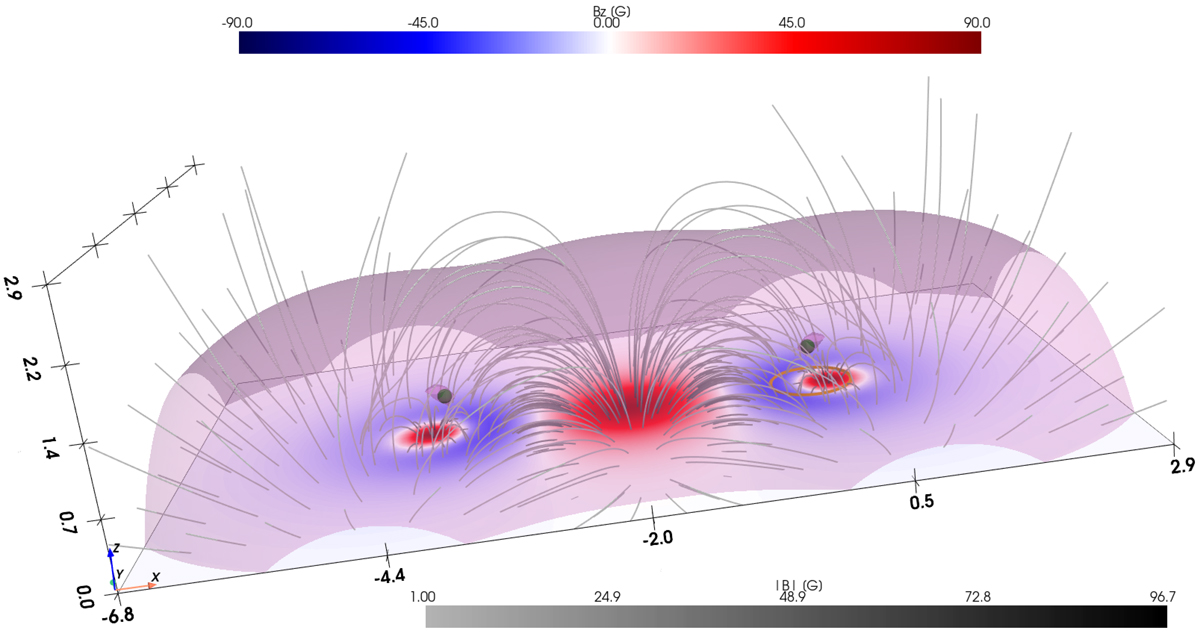
Initial configuration of the magnetic field. The vertical component of the magnetic field is plotted at the bottom of the domain. The two null points are indicated by small spheres. The field lines are plotted using a gray color map, which shows the magnitude of the magnetic field. The orange circle below one of the null points indicates the location of the velocity perturbation defined by Eq. (3), which has a center at the projection of the perturbed null point on the bottom boundary and a radius equal to ![]() Mm. The isocontours of βplasma=1 are shown by a semiopaque violet mesh of two regions, one encapsulating the two null points and an outer region.
Mm. The isocontours of βplasma=1 are shown by a semiopaque violet mesh of two regions, one encapsulating the two null points and an outer region.
Current usage metrics show cumulative count of Article Views (full-text article views including HTML views, PDF and ePub downloads, according to the available data) and Abstracts Views on Vision4Press platform.
Data correspond to usage on the plateform after 2015. The current usage metrics is available 48-96 hours after online publication and is updated daily on week days.
Initial download of the metrics may take a while.