Fig. 9
Download original image
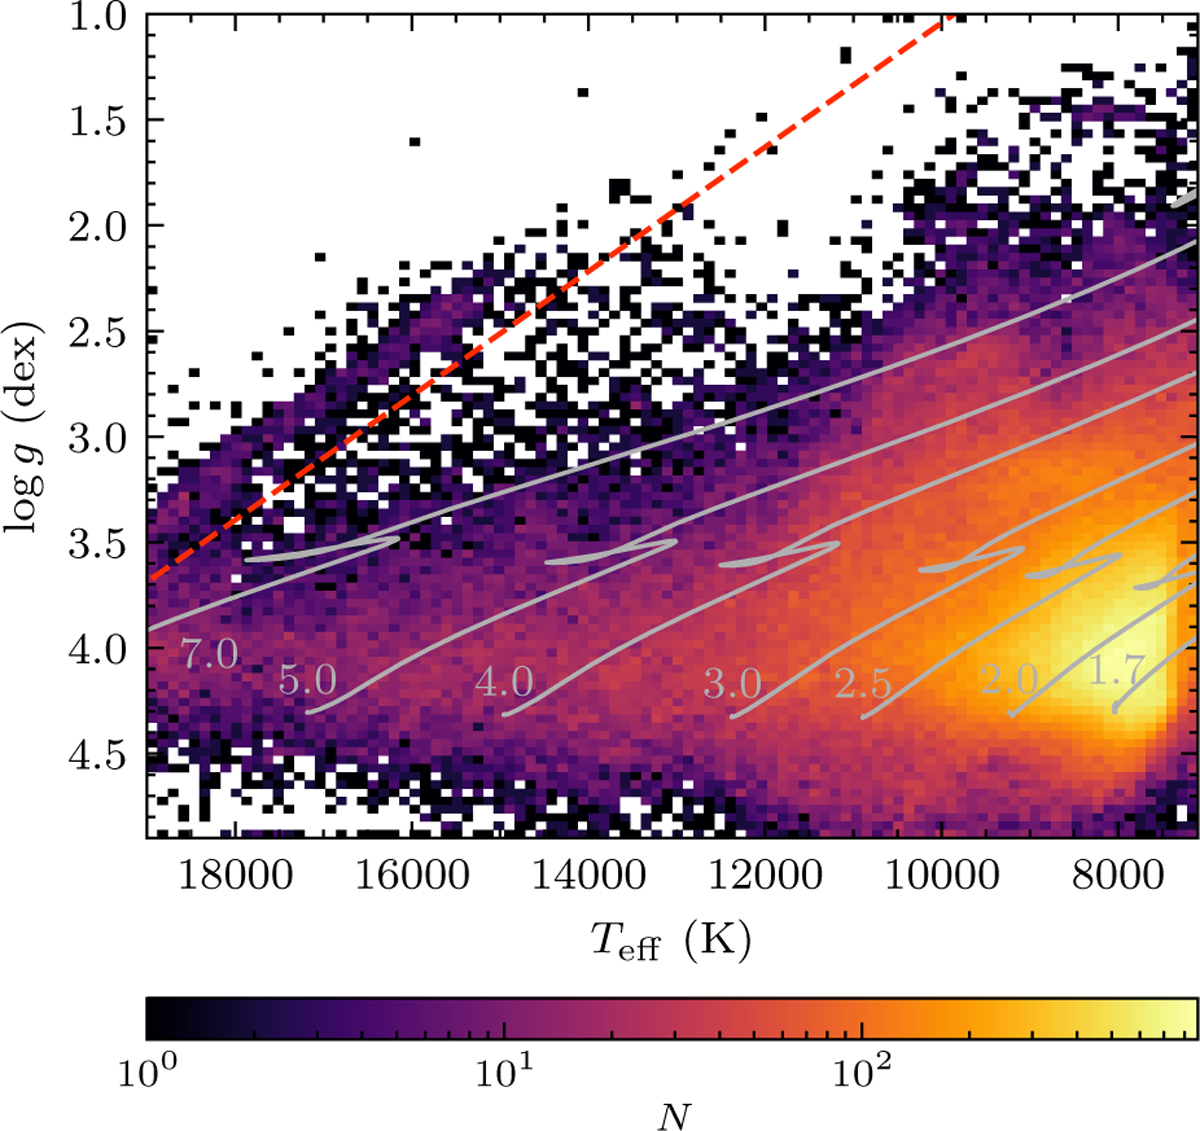
Distribution of candidate stars with r-band S/N > 10 in the Kiel diagram. Stellar density is colour-coded on a logarithmic scale. Temperature cuts at 7100 K and 19 000 K are applied. Stars above the dashed red line represent artefacts from intrinsically hotter stars (Teff ⩾ 20 000 K) and are excluded from further analysis. Grey curves show evolutionary tracks for stars with masses of 1.7, 2.0, 2.5, 3.0, 4.0, 5.0, and 7.0 M⊙ from MIST (Paxton et al. 2011; Choi et al. 2016) models.
Current usage metrics show cumulative count of Article Views (full-text article views including HTML views, PDF and ePub downloads, according to the available data) and Abstracts Views on Vision4Press platform.
Data correspond to usage on the plateform after 2015. The current usage metrics is available 48-96 hours after online publication and is updated daily on week days.
Initial download of the metrics may take a while.