Fig. 5
Download original image
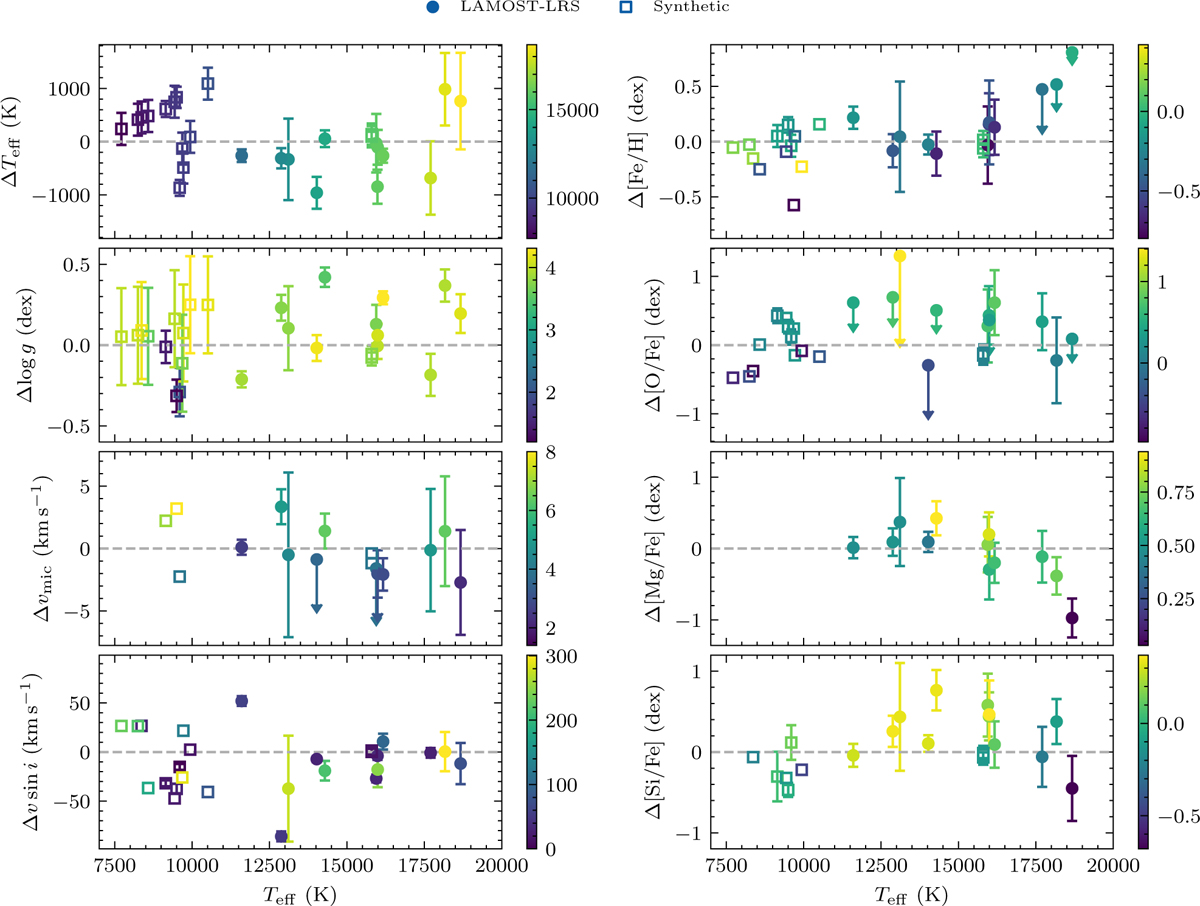
Label differences Δl = llit − l between literature results from high-resolution spectroscopy and this work, plotted against Teff. Coloured symbols denote benchmark stars with high-resolution data, where colour intensity corresponds to label values. Circles indicate stars with LAMOST LRS spectra, while empty squares represent spectra mimicked from high-resolution observations. Error bars and upper limits reflect uncertainties from Przybilla et al. (2006), Takeda et al. (2008), and Gebruers et al. (2021).
Current usage metrics show cumulative count of Article Views (full-text article views including HTML views, PDF and ePub downloads, according to the available data) and Abstracts Views on Vision4Press platform.
Data correspond to usage on the plateform after 2015. The current usage metrics is available 48-96 hours after online publication and is updated daily on week days.
Initial download of the metrics may take a while.