Open Access
Fig. 4
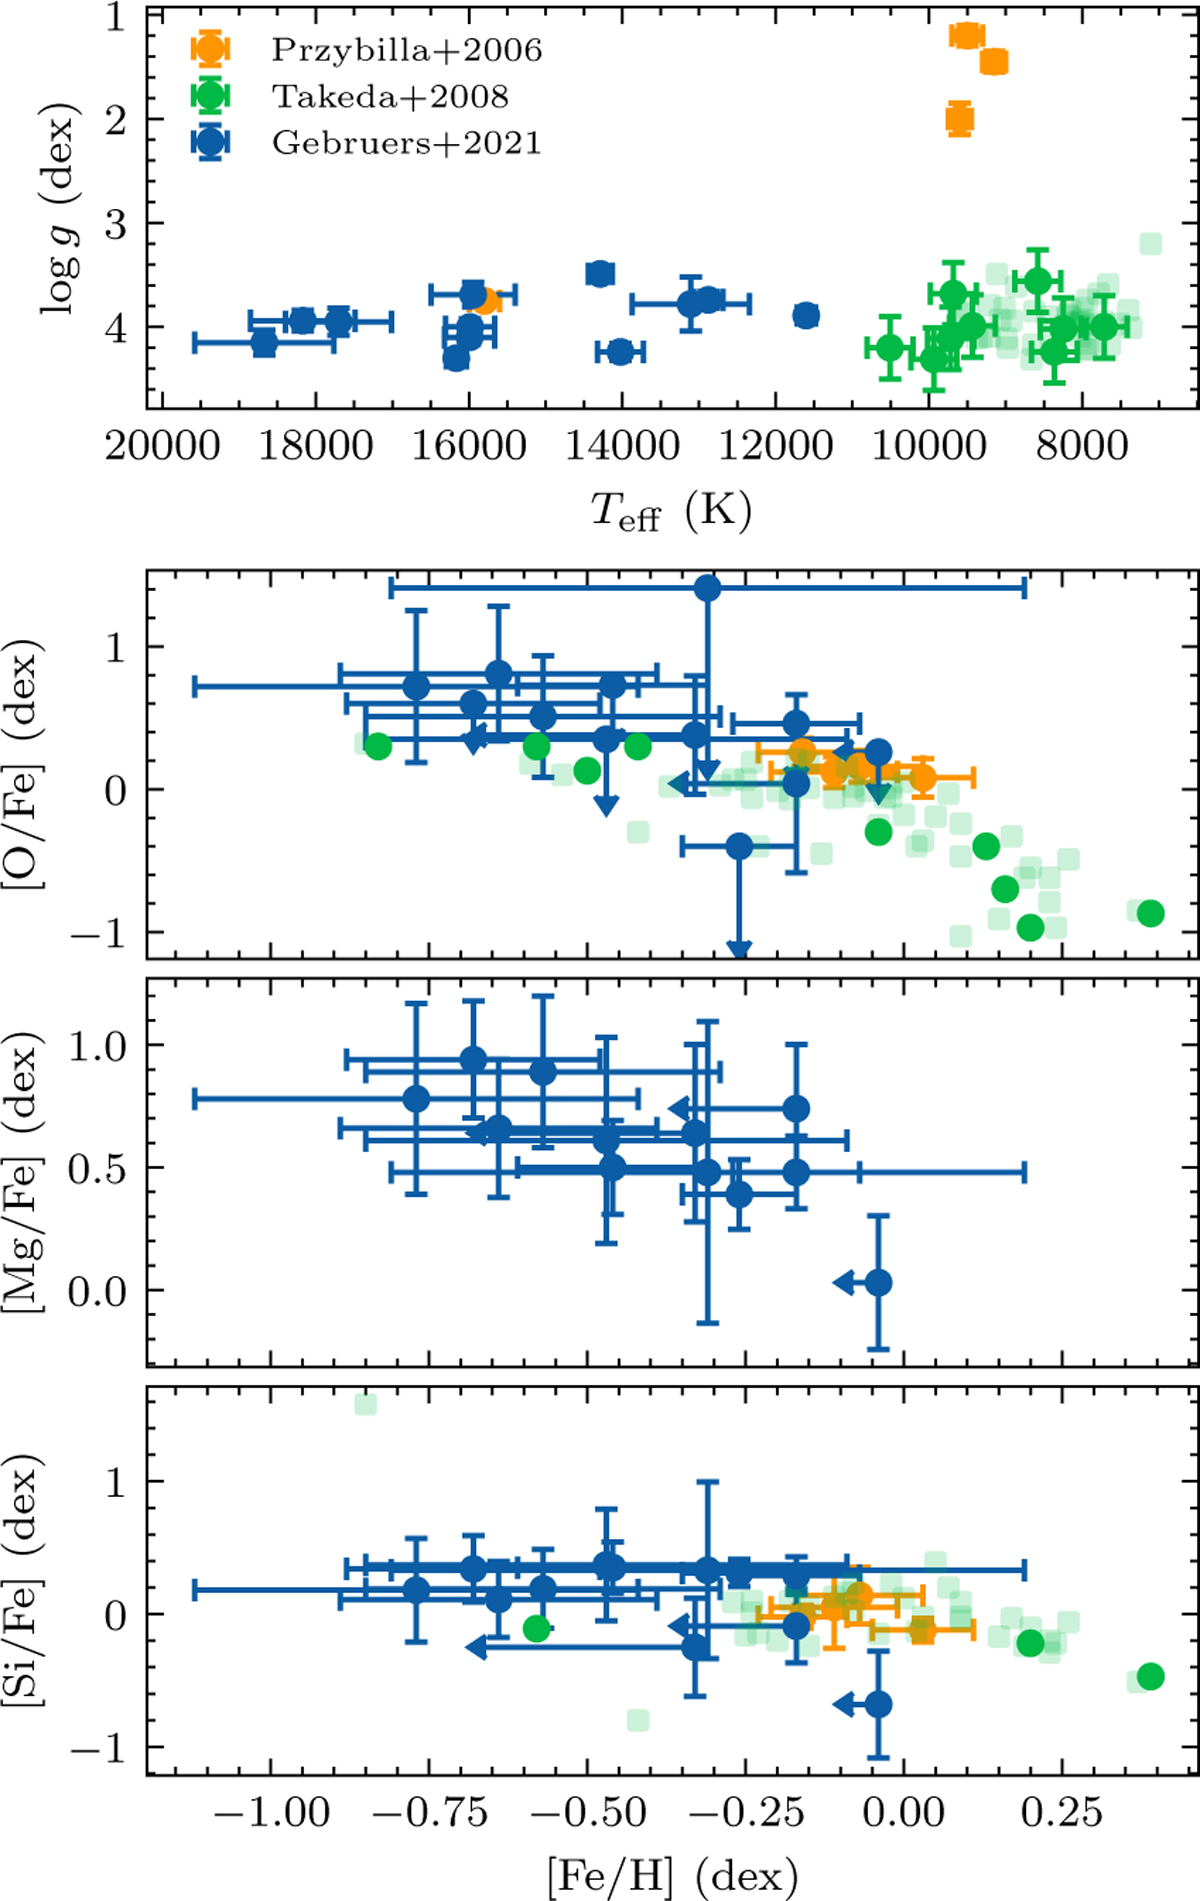
Download original image
Kiel diagram (top panel) and abundance patterns (bottom panel) for benchmark stars. Symbols denote different literature sources: Przybilla et al. (2006, orange), Takeda et al. (2008, green), and Gebruers et al. (2021, blue). Faded markers indicate stars lacking available spectra for direct verification.
Current usage metrics show cumulative count of Article Views (full-text article views including HTML views, PDF and ePub downloads, according to the available data) and Abstracts Views on Vision4Press platform.
Data correspond to usage on the plateform after 2015. The current usage metrics is available 48-96 hours after online publication and is updated daily on week days.
Initial download of the metrics may take a while.