Fig. 3
Download original image
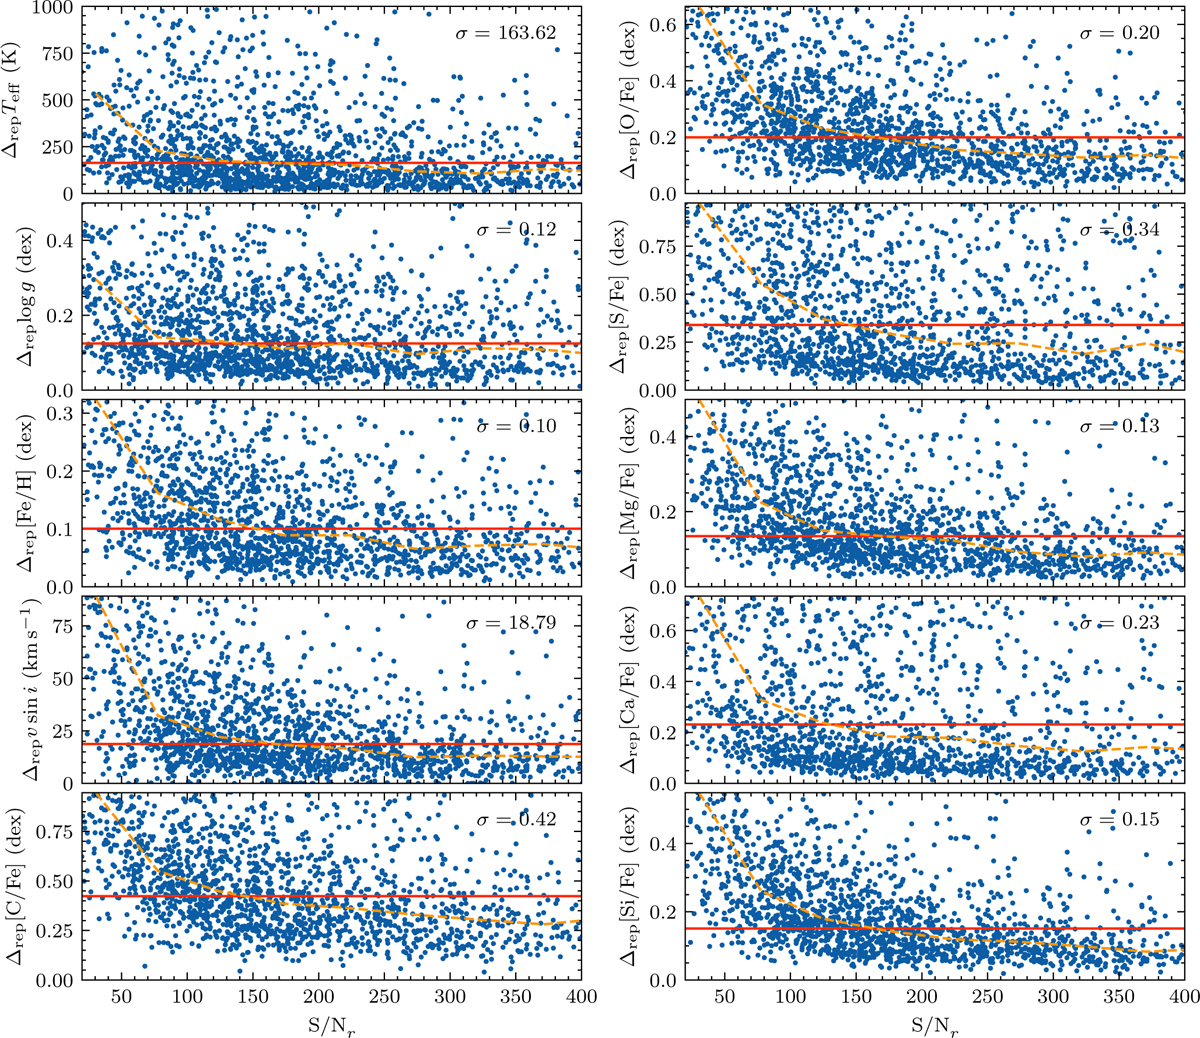
Scatter of labels between repeated observations. The S/Nr is defined as the average value of the S/N in the r band of the observations, and the scatter Δrepl is the standard deviation of the labels in the units applicable to the respective labels, weighted by their S/N. Dashed orange lines represent the median value of the scatter in each S/N bin. Horizontal red lines indicate the median value of Δrepl from the entire sample with repeated observations, which are also marked in the top-right corner.
Current usage metrics show cumulative count of Article Views (full-text article views including HTML views, PDF and ePub downloads, according to the available data) and Abstracts Views on Vision4Press platform.
Data correspond to usage on the plateform after 2015. The current usage metrics is available 48-96 hours after online publication and is updated daily on week days.
Initial download of the metrics may take a while.