Open Access
Fig. A.1
Download original image
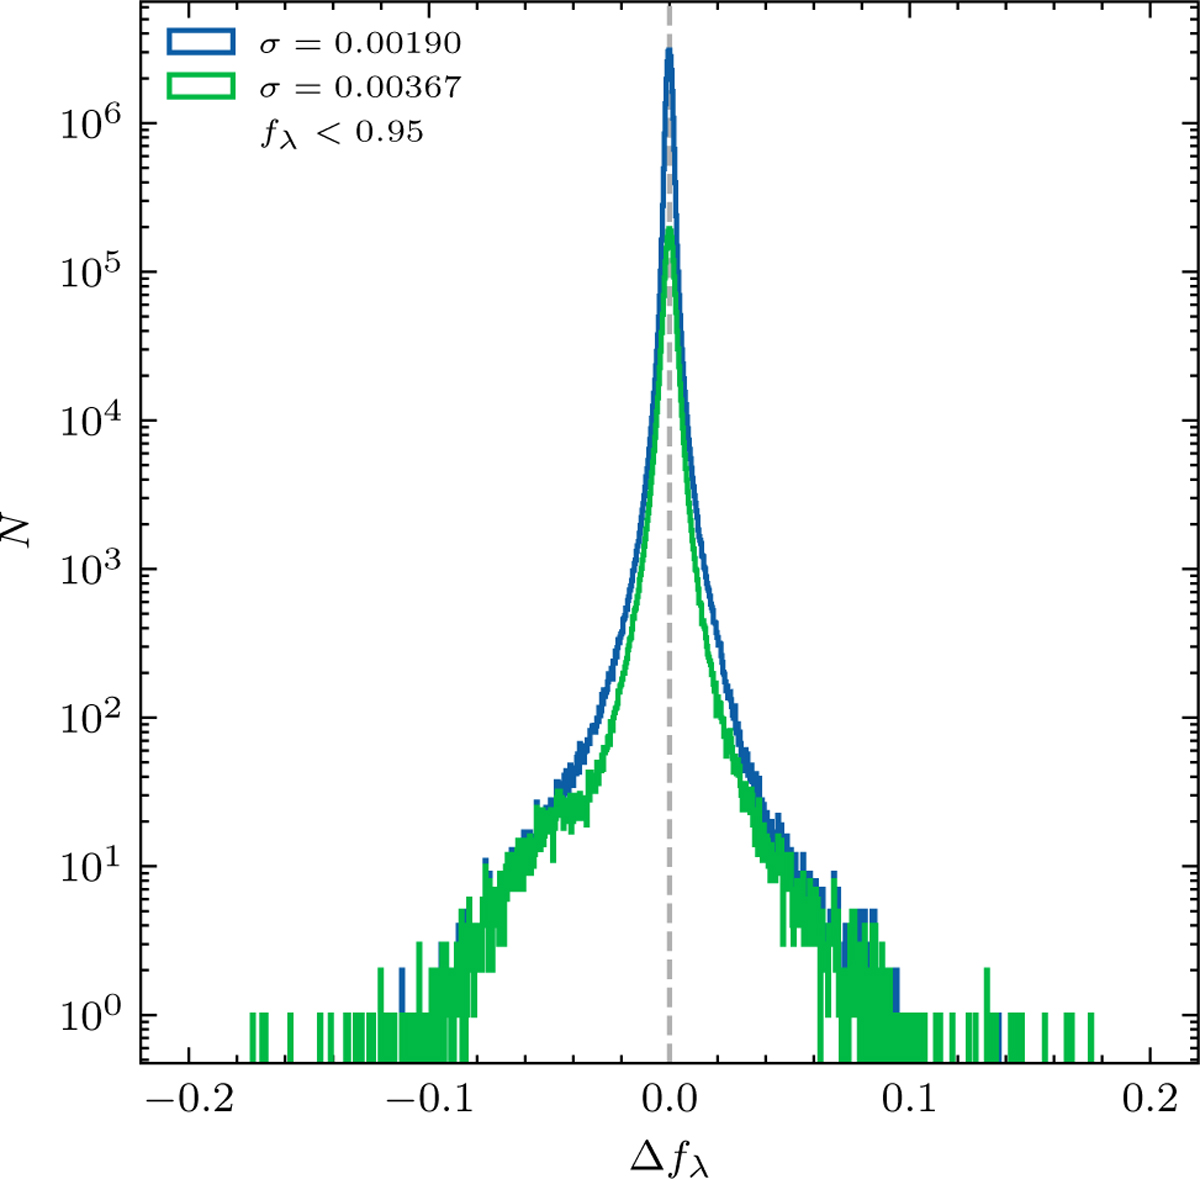
Distribution of flux residuals for 5000 test spectra at S/N = 1000. Standard deviations for all pixels (blue) and pixels with normalised flux fλ < 0.95 (green) are indicated in the top-left corner. The latter criterion selects line-core regions of strong absorption features.
Current usage metrics show cumulative count of Article Views (full-text article views including HTML views, PDF and ePub downloads, according to the available data) and Abstracts Views on Vision4Press platform.
Data correspond to usage on the plateform after 2015. The current usage metrics is available 48-96 hours after online publication and is updated daily on week days.
Initial download of the metrics may take a while.