Fig. 13
Download original image
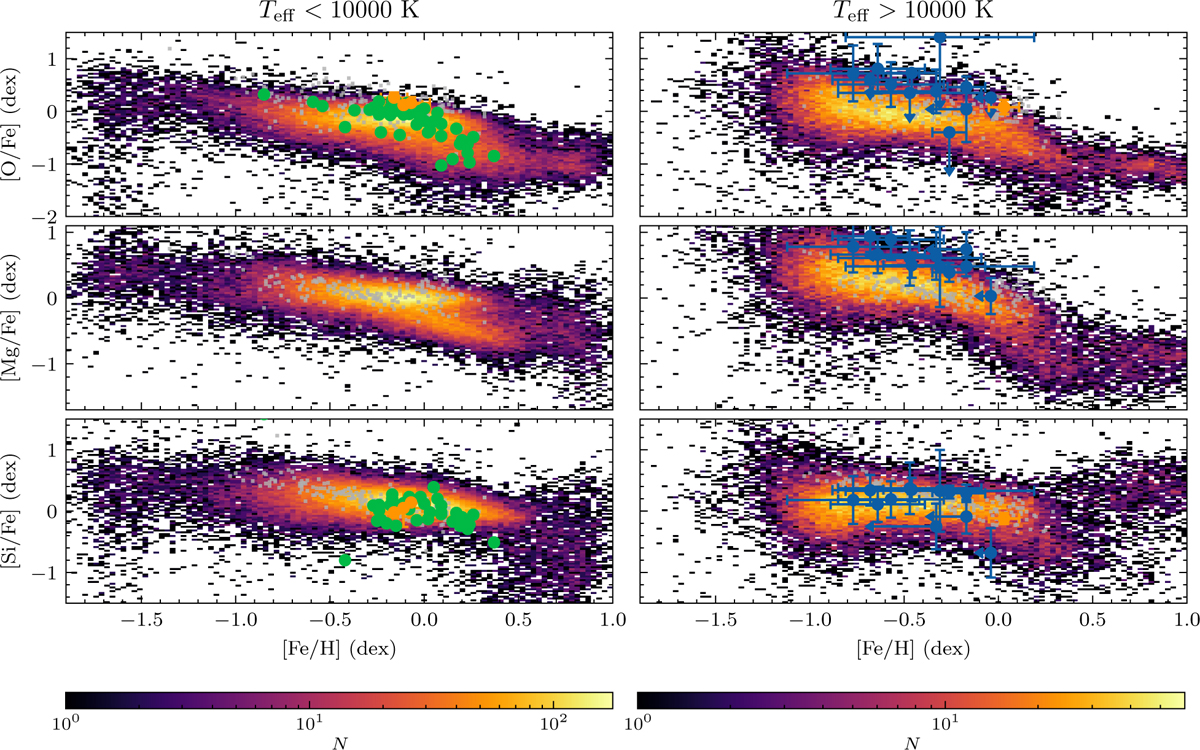
Elemental abundance distribution of the sample in the [X/Fe]–[Fe/H] plane. Only stars with S/Nr > 100 are shown. The sample is separated into two temperature bins: Teff < 10 000 K (left) and Teff > 10 000 K (right). Coloured circles (with error bars where available) represent literature results from high-resolution spectroscopy used in Sect. 4.1, following the same colour scheme as Fig. 4. Grey dots represent the reference pattern of Classical Cepheids from Trentin et al. (2024).
Current usage metrics show cumulative count of Article Views (full-text article views including HTML views, PDF and ePub downloads, according to the available data) and Abstracts Views on Vision4Press platform.
Data correspond to usage on the plateform after 2015. The current usage metrics is available 48-96 hours after online publication and is updated daily on week days.
Initial download of the metrics may take a while.