Fig. 10
Download original image
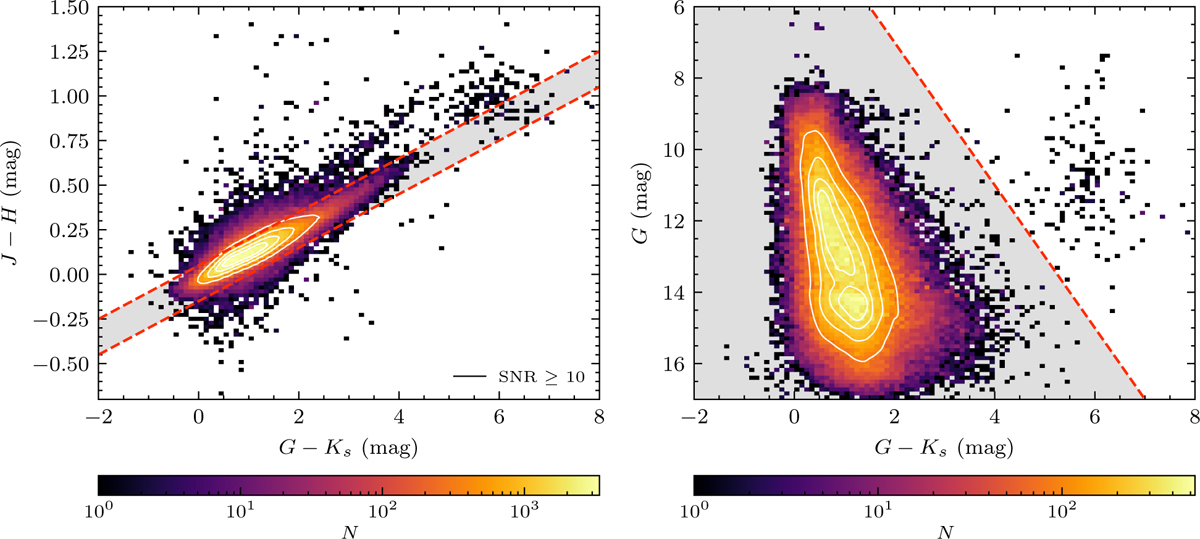
J − H vs G − Ks colour-–colour diagram (left) and G vs G − Ks colour-magnitude diagram (right) for the sample with S/N ⩾ 50. Stellar density is colour-coded on a logarithmic scale. Density contours derived from kernel density estimates are white for the entire sample. Dashed red lines and shaded grey areas delineate the selection criteria for OBA stars as outlined by Zari et al. (2021).
Current usage metrics show cumulative count of Article Views (full-text article views including HTML views, PDF and ePub downloads, according to the available data) and Abstracts Views on Vision4Press platform.
Data correspond to usage on the plateform after 2015. The current usage metrics is available 48-96 hours after online publication and is updated daily on week days.
Initial download of the metrics may take a while.