Fig. 1
Download original image
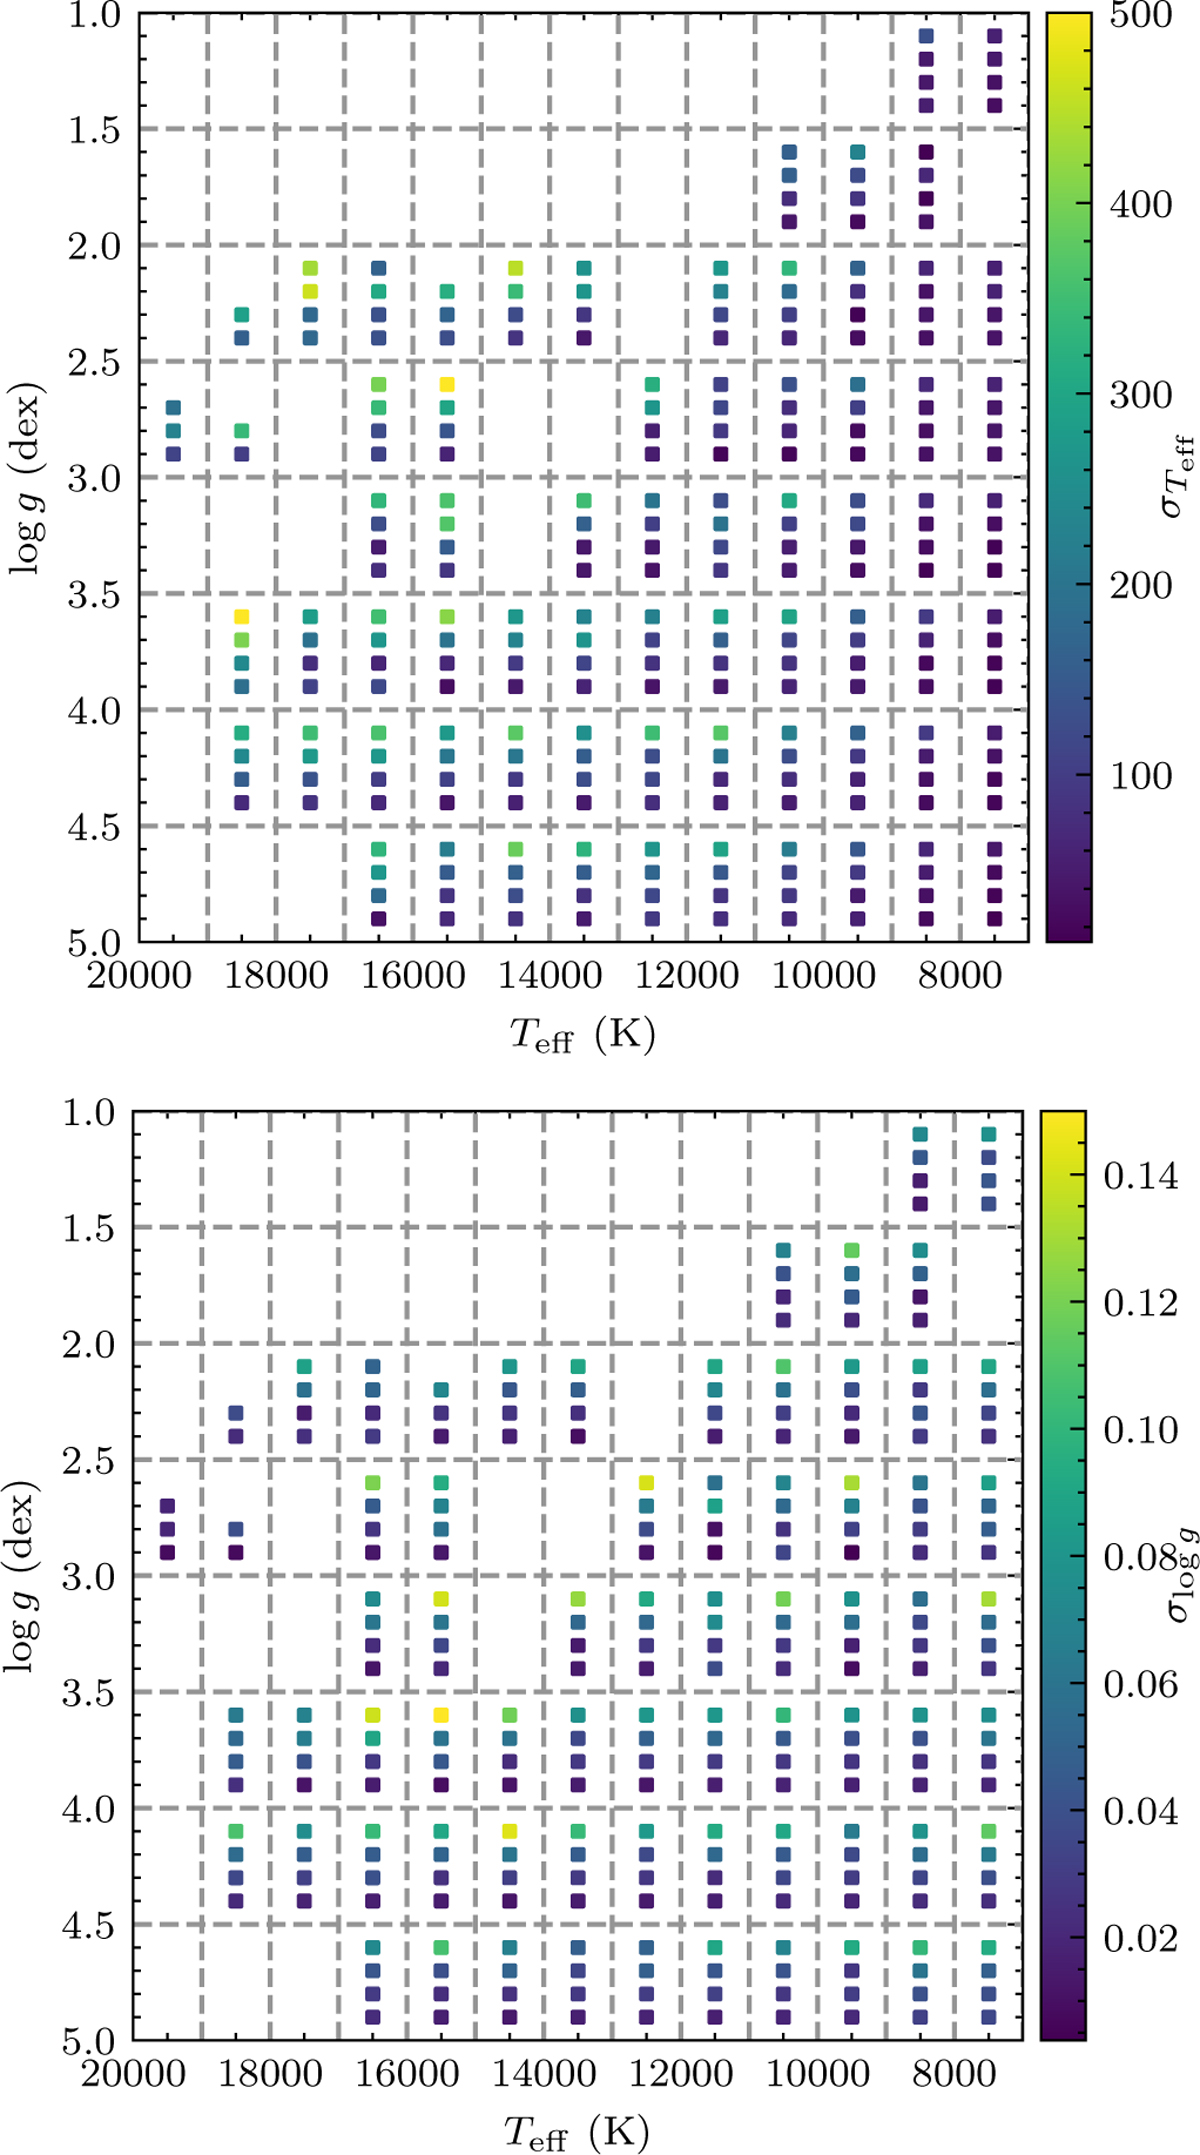
Recovery precision for Teff (top) and log g (bottom) from the SLAM module across the Kiel diagram. Test spectra are binned by ΔTeff = 1000 K and Δ log g = 0.5 dex (delineated by dashed grey lines). For each bin with a significant number of spectra, the four ‘traffic light’ bullets show the standard deviation of the label for S/Ns of (top to bottom) 30, 50, 100, and 250. Empty bins contain insufficient data for robust statistics.
Current usage metrics show cumulative count of Article Views (full-text article views including HTML views, PDF and ePub downloads, according to the available data) and Abstracts Views on Vision4Press platform.
Data correspond to usage on the plateform after 2015. The current usage metrics is available 48-96 hours after online publication and is updated daily on week days.
Initial download of the metrics may take a while.