Fig. 5
Download original image
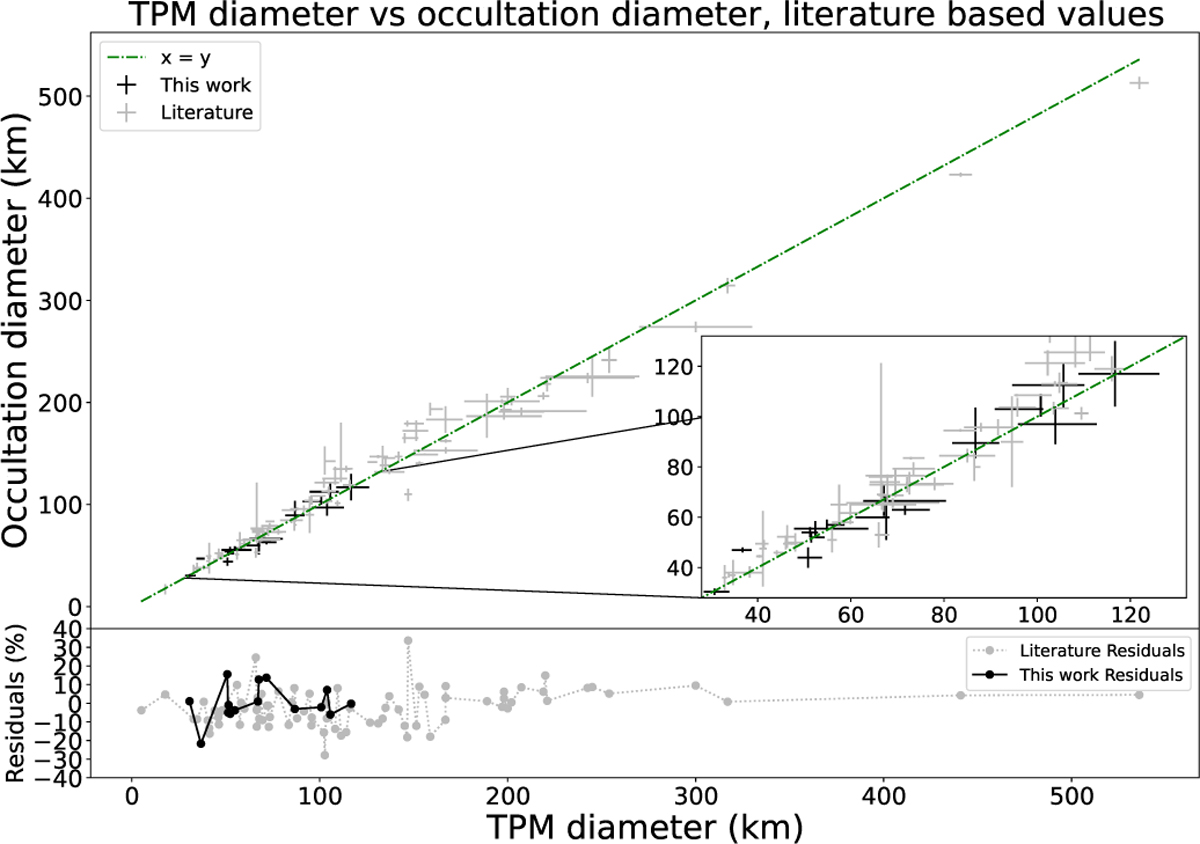
Comparison between thermally derived diameters and occultation-based diameters from the literature (Table A.1). The horizontal axis corresponds to TPM size while the vertical axis is the occultation size. The dashed green line is for y = x. Grey points correspond to values from the literature, while black points correspond to pole-averaged values from this work. Relative residuals are computed as follows: 100 × (DTPM − Docc)/Docc.
Current usage metrics show cumulative count of Article Views (full-text article views including HTML views, PDF and ePub downloads, according to the available data) and Abstracts Views on Vision4Press platform.
Data correspond to usage on the plateform after 2015. The current usage metrics is available 48-96 hours after online publication and is updated daily on week days.
Initial download of the metrics may take a while.