Open Access
Fig. 1
Download original image
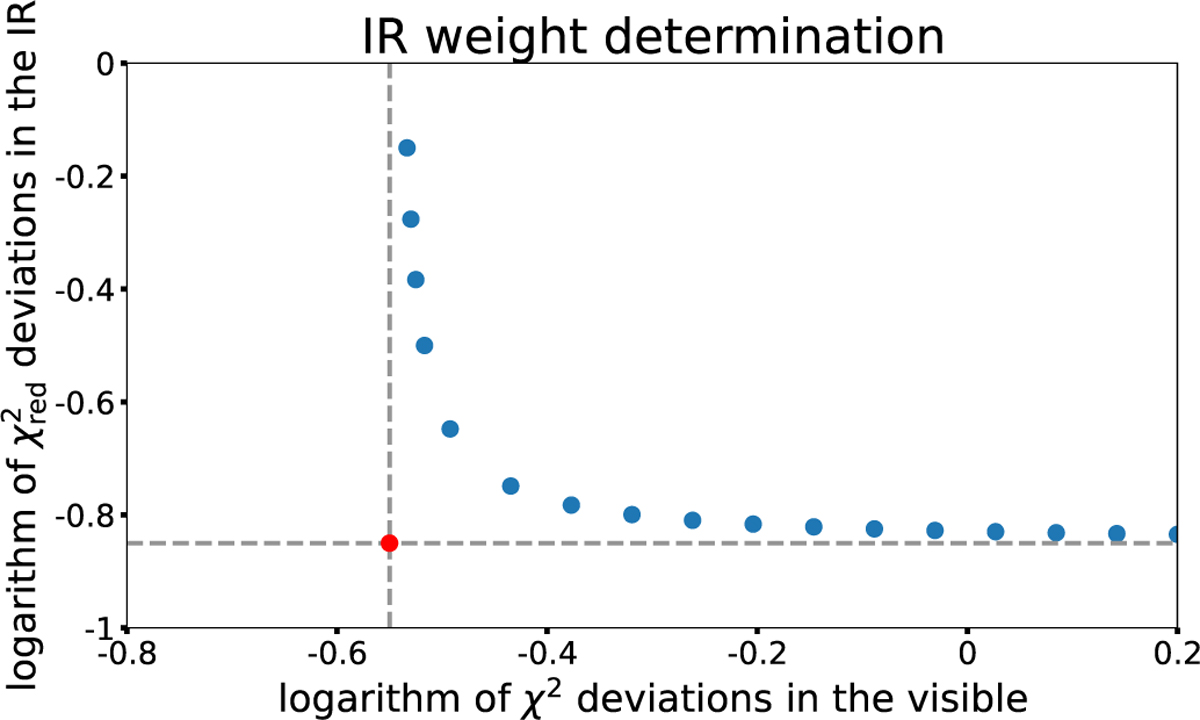
Ideal evolution of ![]() and reduced
and reduced ![]() as a function of ωIR. Each blue point corresponds to a different IR weight. This plot is constrained by two asymptotes along the x-axis and the y-axis. These two asymptotes are used to determine a new origin (red point). The best ωIR value corresponds to the point closest to the new origin.
as a function of ωIR. Each blue point corresponds to a different IR weight. This plot is constrained by two asymptotes along the x-axis and the y-axis. These two asymptotes are used to determine a new origin (red point). The best ωIR value corresponds to the point closest to the new origin.
Current usage metrics show cumulative count of Article Views (full-text article views including HTML views, PDF and ePub downloads, according to the available data) and Abstracts Views on Vision4Press platform.
Data correspond to usage on the plateform after 2015. The current usage metrics is available 48-96 hours after online publication and is updated daily on week days.
Initial download of the metrics may take a while.