Fig. 2.
Download original image
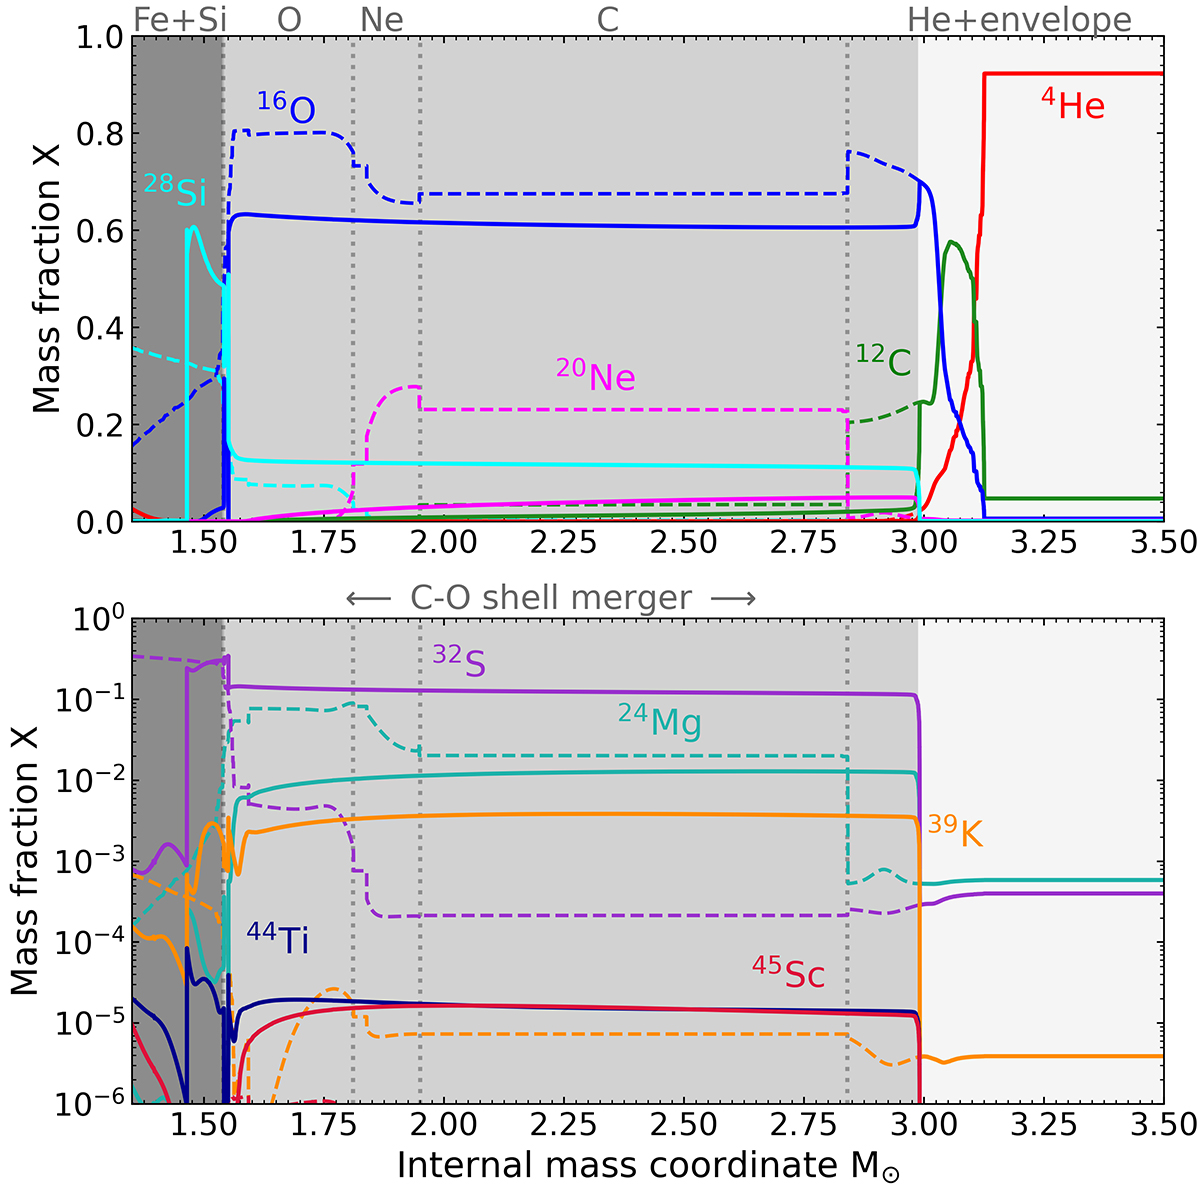
Comparison between the abundances before (dashed lines) and after the C-O shell merger (solid lines) in the RIT 15 M⊙ model at solar metallicity (see Ritter et al. 2018a, for a detailed description of the model). The upper panel shows the effect of the merger on the major fuels. The lower panel shows instead the effect of the merger on some key C- and O-burning products and selected odd-Z isotopes (see text). The vertical dotted lines represent the location of the edges of the shells before the C-O shell merger. The light gray area is the region modified by the merger, the dark gray area represents the untouched deeper layers of the star after the merger, i.e., the Fe core and the Si shell.
Current usage metrics show cumulative count of Article Views (full-text article views including HTML views, PDF and ePub downloads, according to the available data) and Abstracts Views on Vision4Press platform.
Data correspond to usage on the plateform after 2015. The current usage metrics is available 48-96 hours after online publication and is updated daily on week days.
Initial download of the metrics may take a while.