Fig. 5.
Download original image
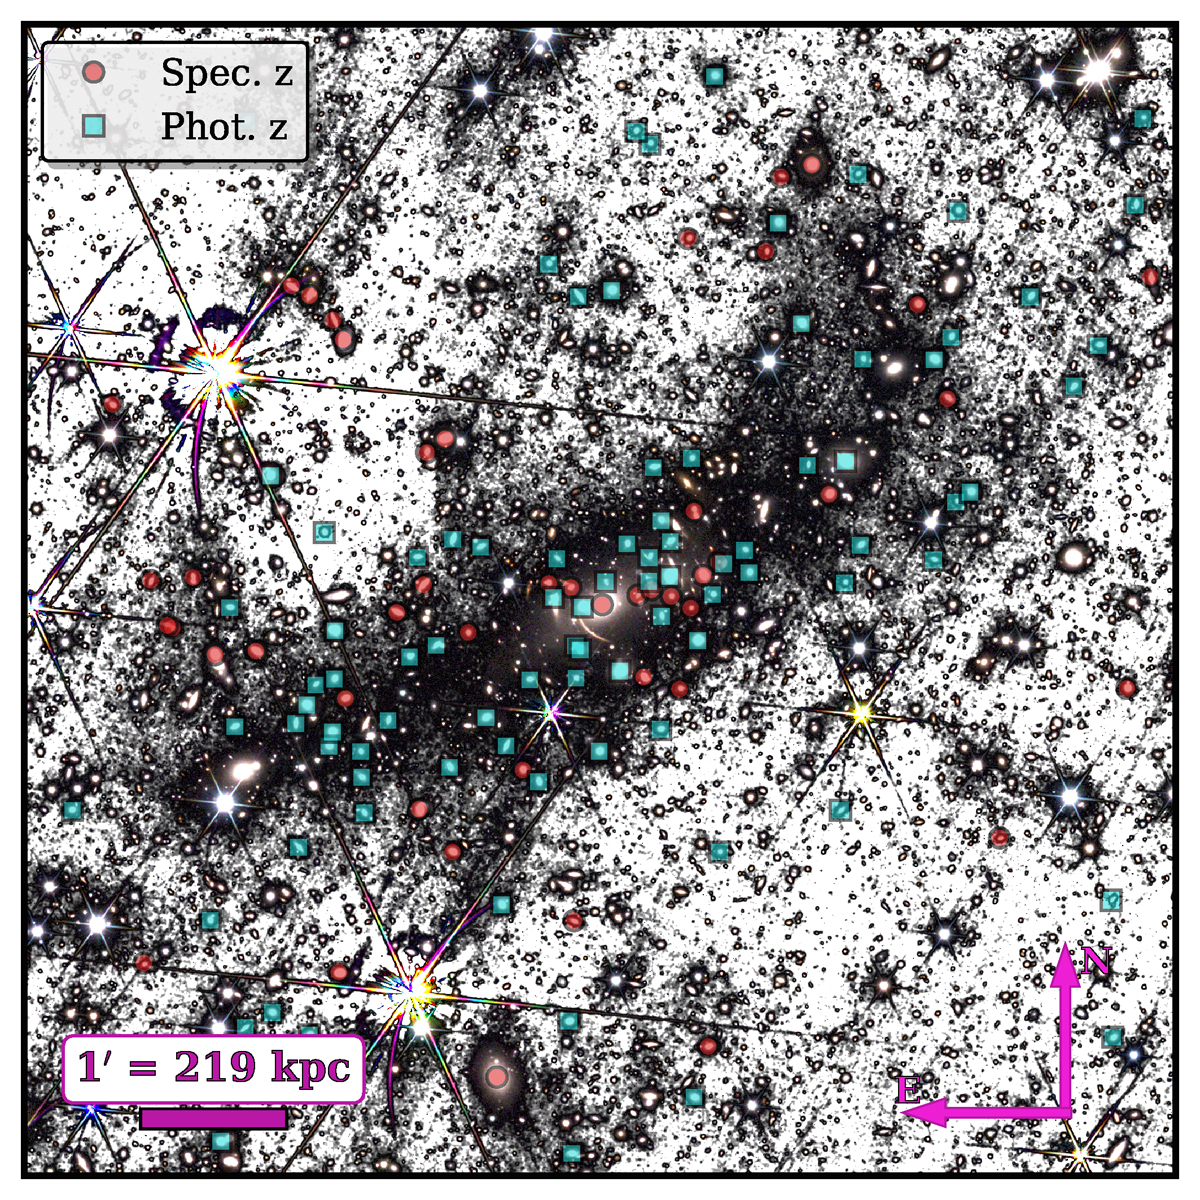
Image of the ![]() Mpc × 2 Mpc, approximately 0.5 R200 of the cluster) region around A 2390. The image is a combination of an RGB image of the PSF-subtracted NISP images and a JE+HE black and white background. Cluster members are colour-coded according to whether their redshift is spectroscopic (red circles) or photometric (teal squares). North is up, and east is to the left. This image highlights the importance of removing bright stars close to the cluster centre to study the diffuse light (see Sect. 3.1).
Mpc × 2 Mpc, approximately 0.5 R200 of the cluster) region around A 2390. The image is a combination of an RGB image of the PSF-subtracted NISP images and a JE+HE black and white background. Cluster members are colour-coded according to whether their redshift is spectroscopic (red circles) or photometric (teal squares). North is up, and east is to the left. This image highlights the importance of removing bright stars close to the cluster centre to study the diffuse light (see Sect. 3.1).
Current usage metrics show cumulative count of Article Views (full-text article views including HTML views, PDF and ePub downloads, according to the available data) and Abstracts Views on Vision4Press platform.
Data correspond to usage on the plateform after 2015. The current usage metrics is available 48-96 hours after online publication and is updated daily on week days.
Initial download of the metrics may take a while.