Fig. 3.
Download original image
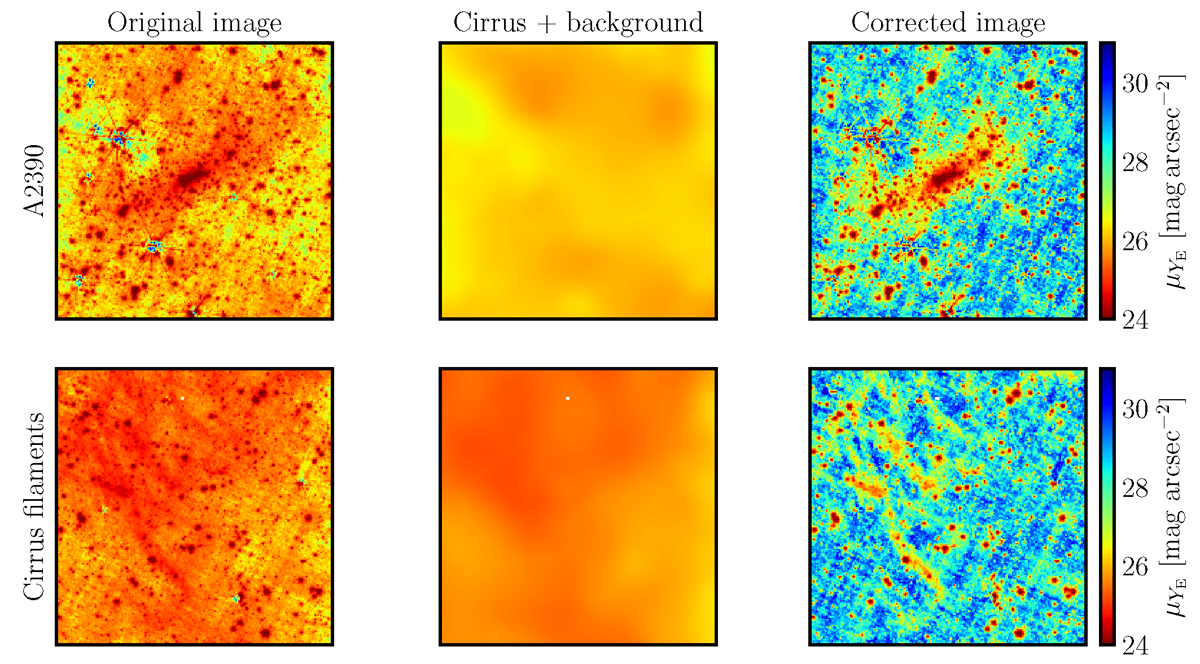
Zoom-in on regions of interest in the YE band, which displays the most cirrus residuals after correction. Top row shows a ![]() image centred on A 2390. Bottom row shows a high-intensity cirrus region (
image centred on A 2390. Bottom row shows a high-intensity cirrus region (![]() ) situated in the east of the image, displaying obvious small-scale cirrus residuals in the corrected image. Left to right: Original image; cirrus model; cirrus-corrected image.
) situated in the east of the image, displaying obvious small-scale cirrus residuals in the corrected image. Left to right: Original image; cirrus model; cirrus-corrected image.
Current usage metrics show cumulative count of Article Views (full-text article views including HTML views, PDF and ePub downloads, according to the available data) and Abstracts Views on Vision4Press platform.
Data correspond to usage on the plateform after 2015. The current usage metrics is available 48-96 hours after online publication and is updated daily on week days.
Initial download of the metrics may take a while.