Fig. 3
Download original image
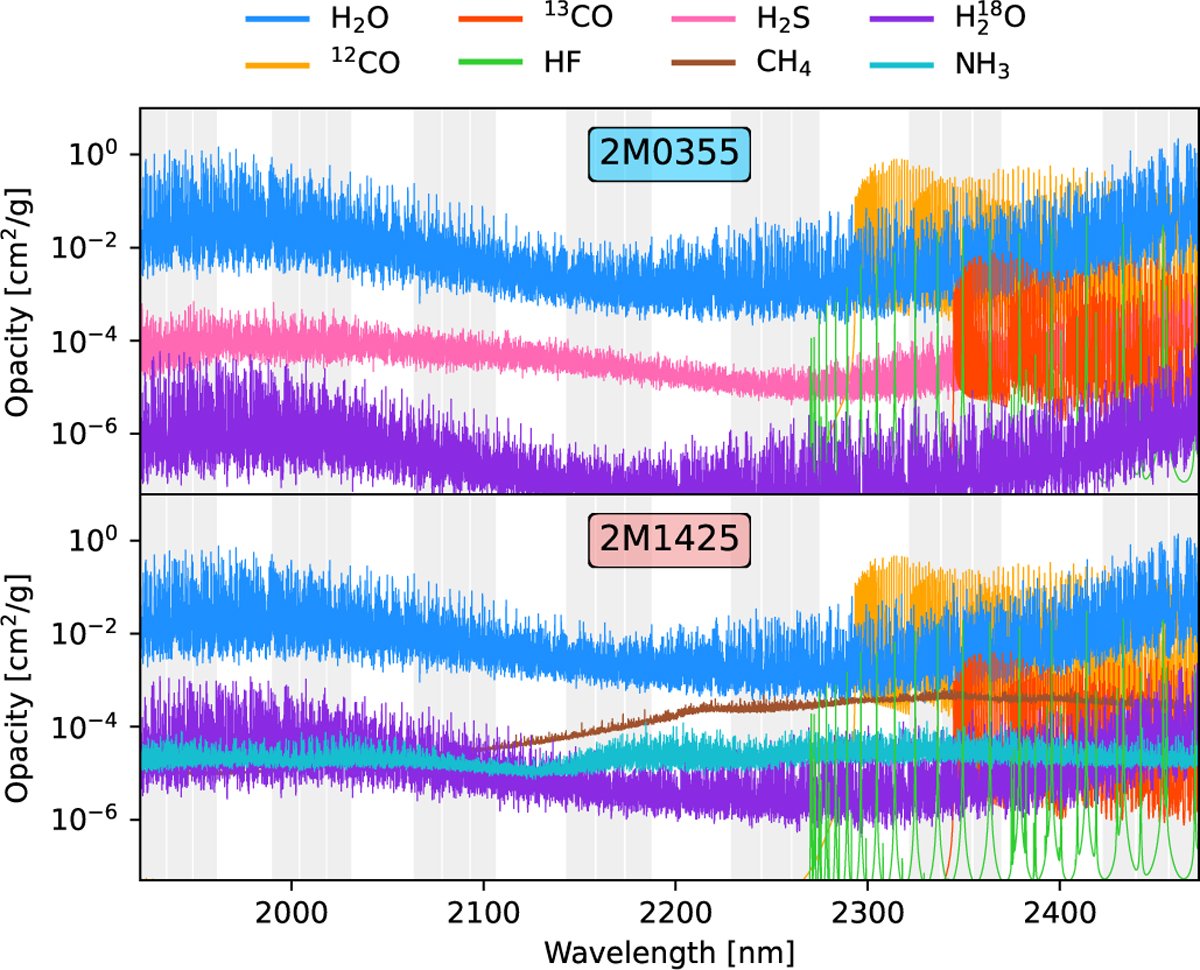
Most relevant opacity sources of 2M0355 (top) and 2M1425 (bottom), at the temperature present at the pressure where the emission contribution is maximal (1580 K and 1850 K, respectively). The opacities are scaled to the retrieved abundances (see Table 2). The vertically shaded regions show the wavelength coverage of the K2166-band.
Current usage metrics show cumulative count of Article Views (full-text article views including HTML views, PDF and ePub downloads, according to the available data) and Abstracts Views on Vision4Press platform.
Data correspond to usage on the plateform after 2015. The current usage metrics is available 48-96 hours after online publication and is updated daily on week days.
Initial download of the metrics may take a while.