Fig. 4.
Download original image
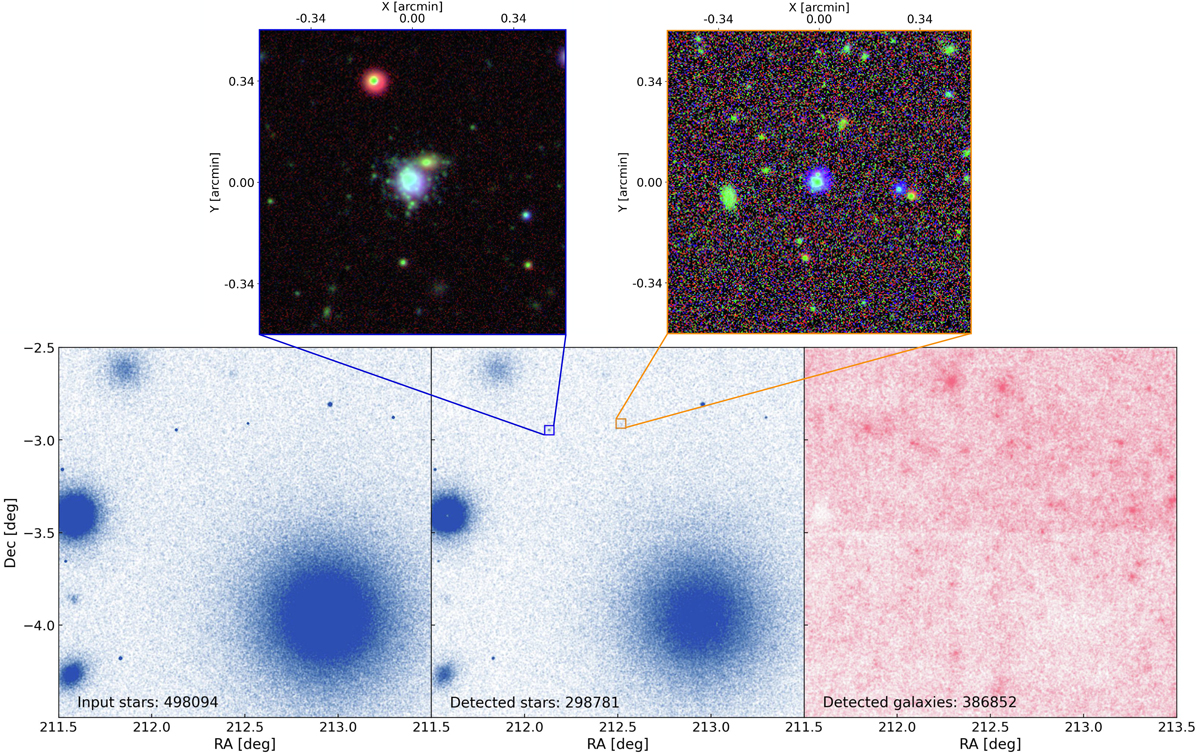
Comparison of the input and detected stars and galaxies for four tiles. The left panel displays the input stars and the middle panel shows the detected stars that are cross-matched with the input catalogue, indicating that only about 60% of the stars survived the image simulation and source extraction process. The right panel illustrates the detected galaxies identified. Two zoom-in panels show the local environments of two injected satellites. The left panel (blue rectangle) shows a satellite with multiple member stars identified, while the right panel (orange rectangle) shows very few of the member stars are detected, likely due to its compactness and the higher background noise in that region.
Current usage metrics show cumulative count of Article Views (full-text article views including HTML views, PDF and ePub downloads, according to the available data) and Abstracts Views on Vision4Press platform.
Data correspond to usage on the plateform after 2015. The current usage metrics is available 48-96 hours after online publication and is updated daily on week days.
Initial download of the metrics may take a while.