Fig. 3.
Download original image
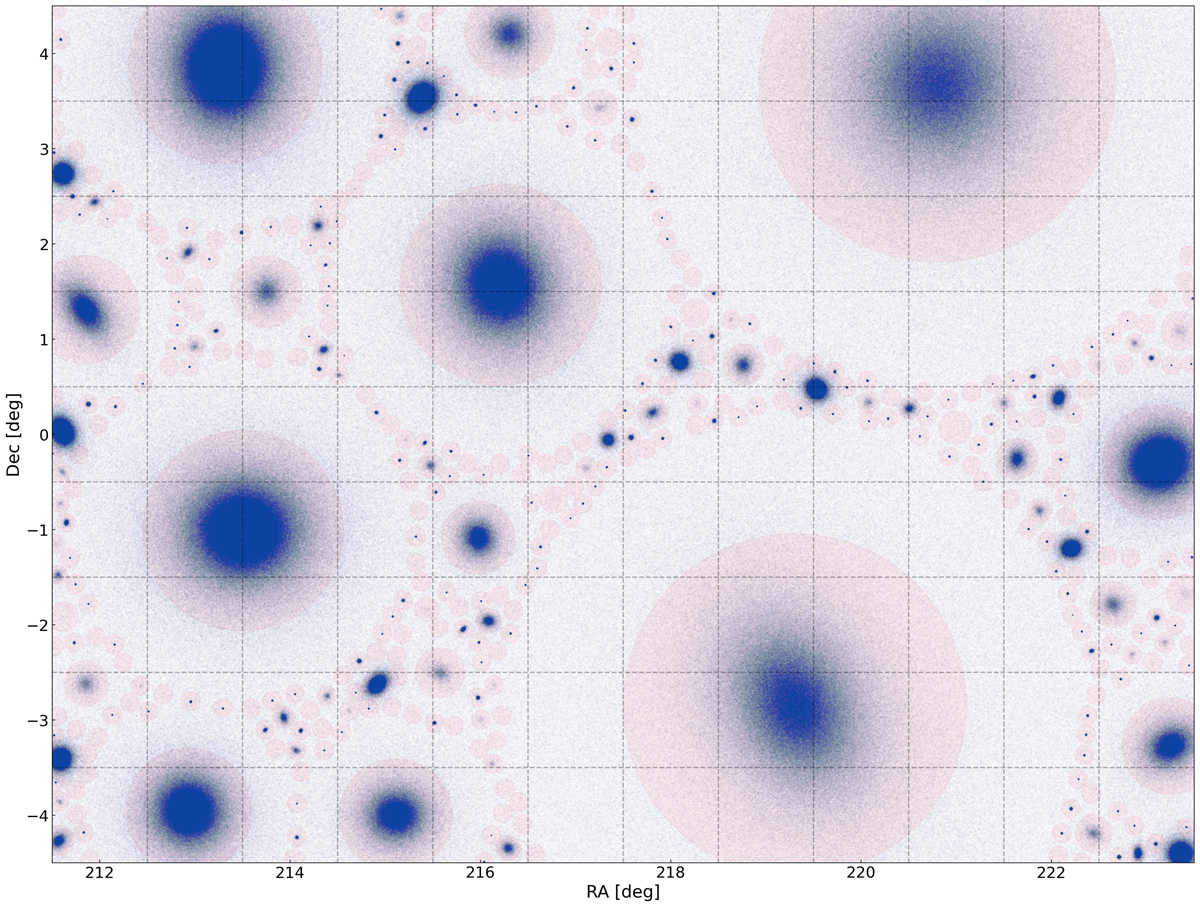
Input star catalogue for one of the 108 deg2 generated images. Each square block represents a tile in KiDS-like image generation. The red circles indicate the locations of the mock satellites, with the radii representing the smallest separation for each pair of mock satellites with F = 3 in Eq. (1). Each blue point represents a star, with the input star catalogue consisting of satellite member stars and foreground stars.
Current usage metrics show cumulative count of Article Views (full-text article views including HTML views, PDF and ePub downloads, according to the available data) and Abstracts Views on Vision4Press platform.
Data correspond to usage on the plateform after 2015. The current usage metrics is available 48-96 hours after online publication and is updated daily on week days.
Initial download of the metrics may take a while.