Fig. A.1.
Download original image
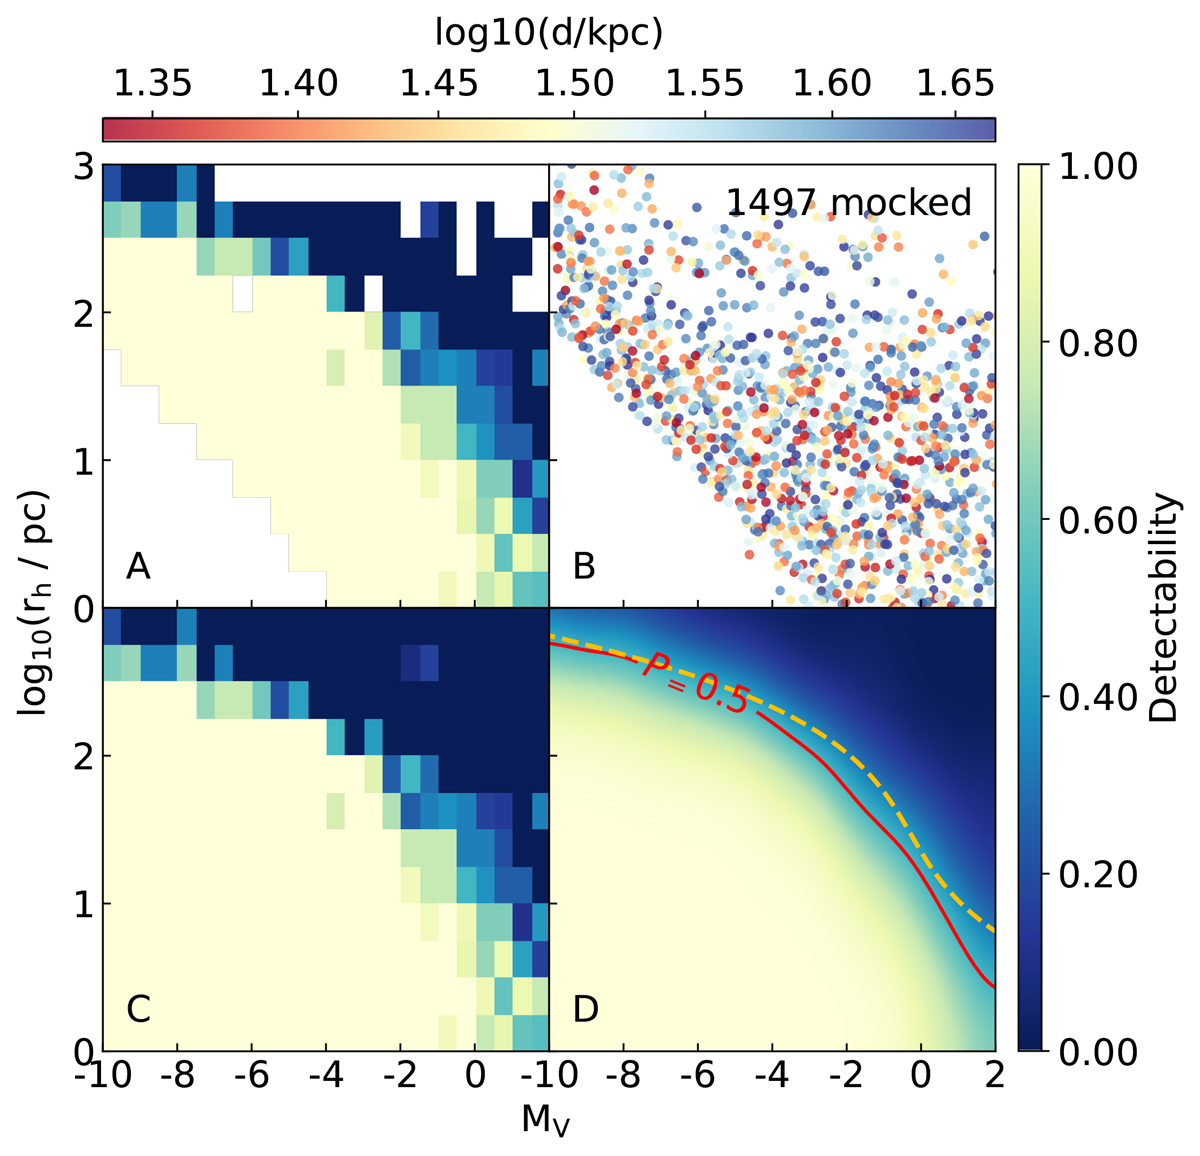
Example of the detectability interpolation and smoothing for the catalogue-level simulation in the second distance bin with d in the range of [21.5, 46.4] kpc. Detection of satellites within this distance range is binned as a function of MV and rh as shown in subplot A. A total of 1497 mock satellites are plotted as scatters in the MV − rh map in subplot B. The 2D interpolation is applied to generate the full detection efficiency map, as shown in subplot C. We apply a Gaussian kernel to smooth the map, with the 50% detectability limit plotted in red in subplot D, and the fitted limit plotted in yellow.
Current usage metrics show cumulative count of Article Views (full-text article views including HTML views, PDF and ePub downloads, according to the available data) and Abstracts Views on Vision4Press platform.
Data correspond to usage on the plateform after 2015. The current usage metrics is available 48-96 hours after online publication and is updated daily on week days.
Initial download of the metrics may take a while.