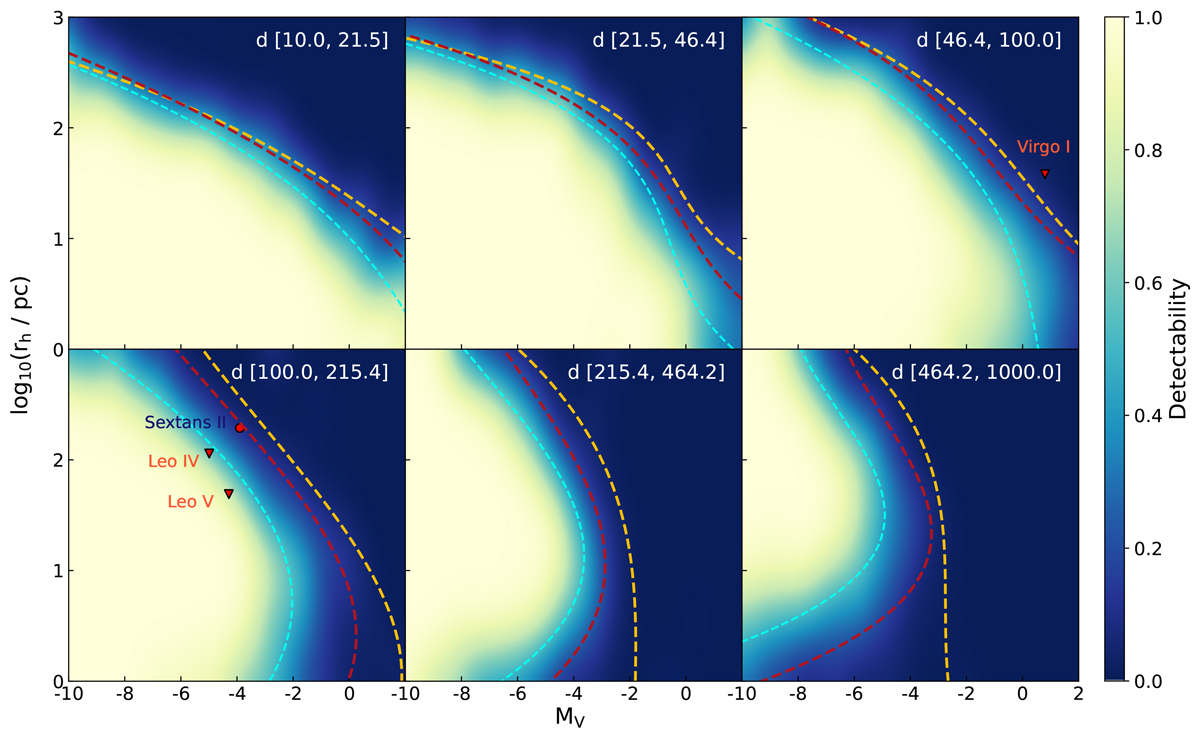
Fig. 11.
Download original image
Same as Fig. 9, except with the star-galaxy separator applied in the image-level (chain A). The detectability ranges from 0% (dark blue) to 100% (bright yellow) similar as shown in Fig. 9. The 50% detectability limits fitted by polynomials (n = 3) are shown in bright blue dashed lines. The detectability limits of image-level and catalogue-level simulations are plotted in red and yellow dashed lines. The satellites found within in KiDS footprint are overplotted in the detection efficiency map.
Current usage metrics show cumulative count of Article Views (full-text article views including HTML views, PDF and ePub downloads, according to the available data) and Abstracts Views on Vision4Press platform.
Data correspond to usage on the plateform after 2015. The current usage metrics is available 48-96 hours after online publication and is updated daily on week days.
Initial download of the metrics may take a while.