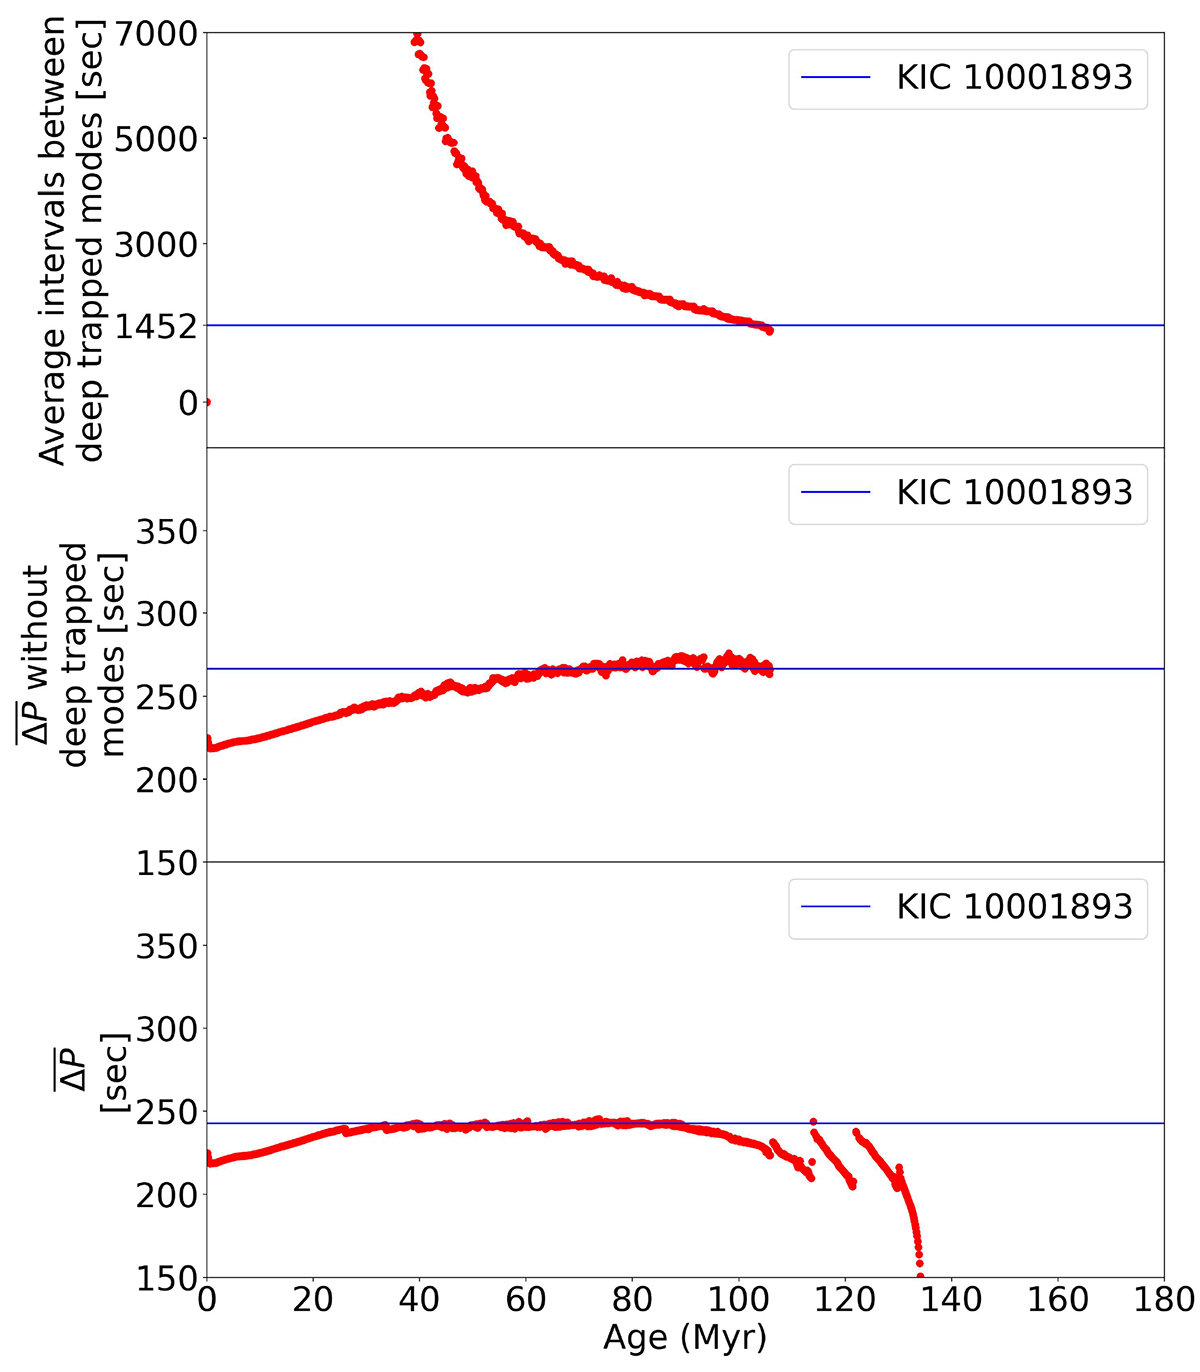
Fig. 7.
Download original image
Top panel: Average interval between the deep trapped modes during the second stage of evolving the sdB models for the CPM scheme, as shown in Fig. 4b by red dots, and the observed mean distances between three deep trapped modes of KIC 10001893, depicted with a blue line. Middle panel: Mean period spacing without considering the deep trapped modes in the first and second evolutionary stages of the sdB models, illustrated by red dots. The blue line represents the observed mean period spacing, excluding three deep trapped modes and three semi-trapped modes of KIC 10001893. Bottom panel: Mean period spacing of all modes in all the evolutionary stages of He-burning of the sdB models, as depicted by red dots. The blue line displays the observed mean period spacing of all modes of KIC 10001893.
Current usage metrics show cumulative count of Article Views (full-text article views including HTML views, PDF and ePub downloads, according to the available data) and Abstracts Views on Vision4Press platform.
Data correspond to usage on the plateform after 2015. The current usage metrics is available 48-96 hours after online publication and is updated daily on week days.
Initial download of the metrics may take a while.