Open Access
Fig. 2.
Download original image
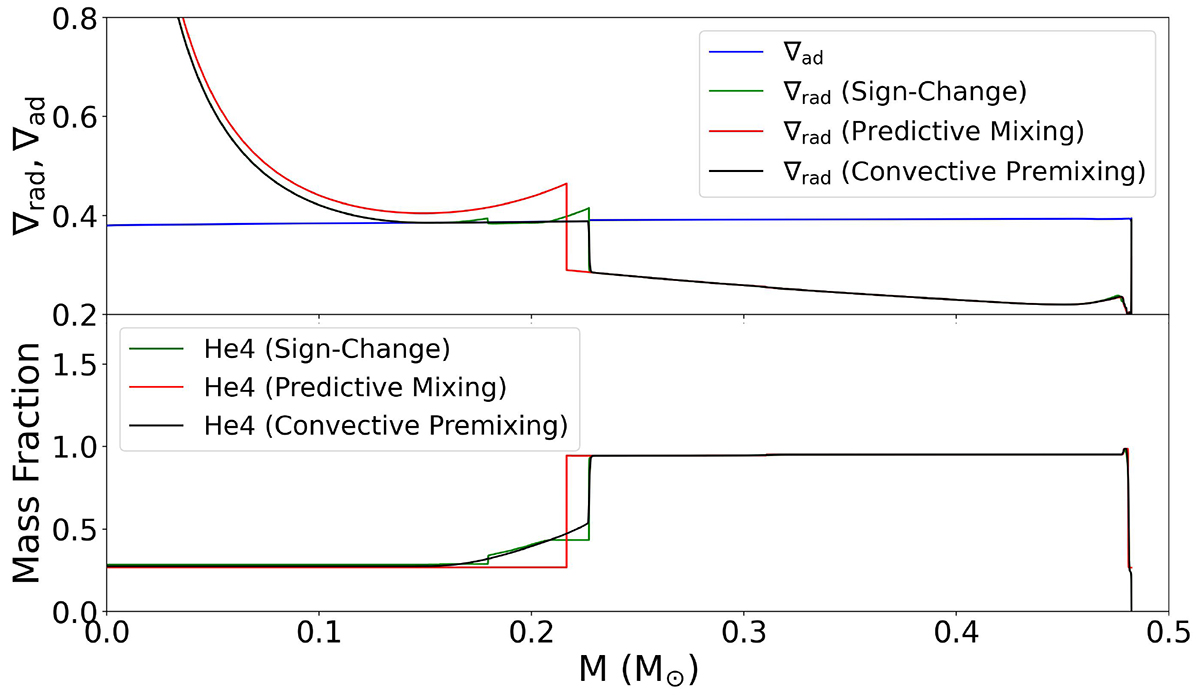
Top panel: Adiabatic gradient (blue) and radiative gradients for three distinct sdB models – sign-change (green), PM (red), and CPM (black) – plotted as a function of the mass coordinate at 80 Myr. Bottom panel: He mass fraction corresponding to the temperature gradients of each of the three models.
Current usage metrics show cumulative count of Article Views (full-text article views including HTML views, PDF and ePub downloads, according to the available data) and Abstracts Views on Vision4Press platform.
Data correspond to usage on the plateform after 2015. The current usage metrics is available 48-96 hours after online publication and is updated daily on week days.
Initial download of the metrics may take a while.