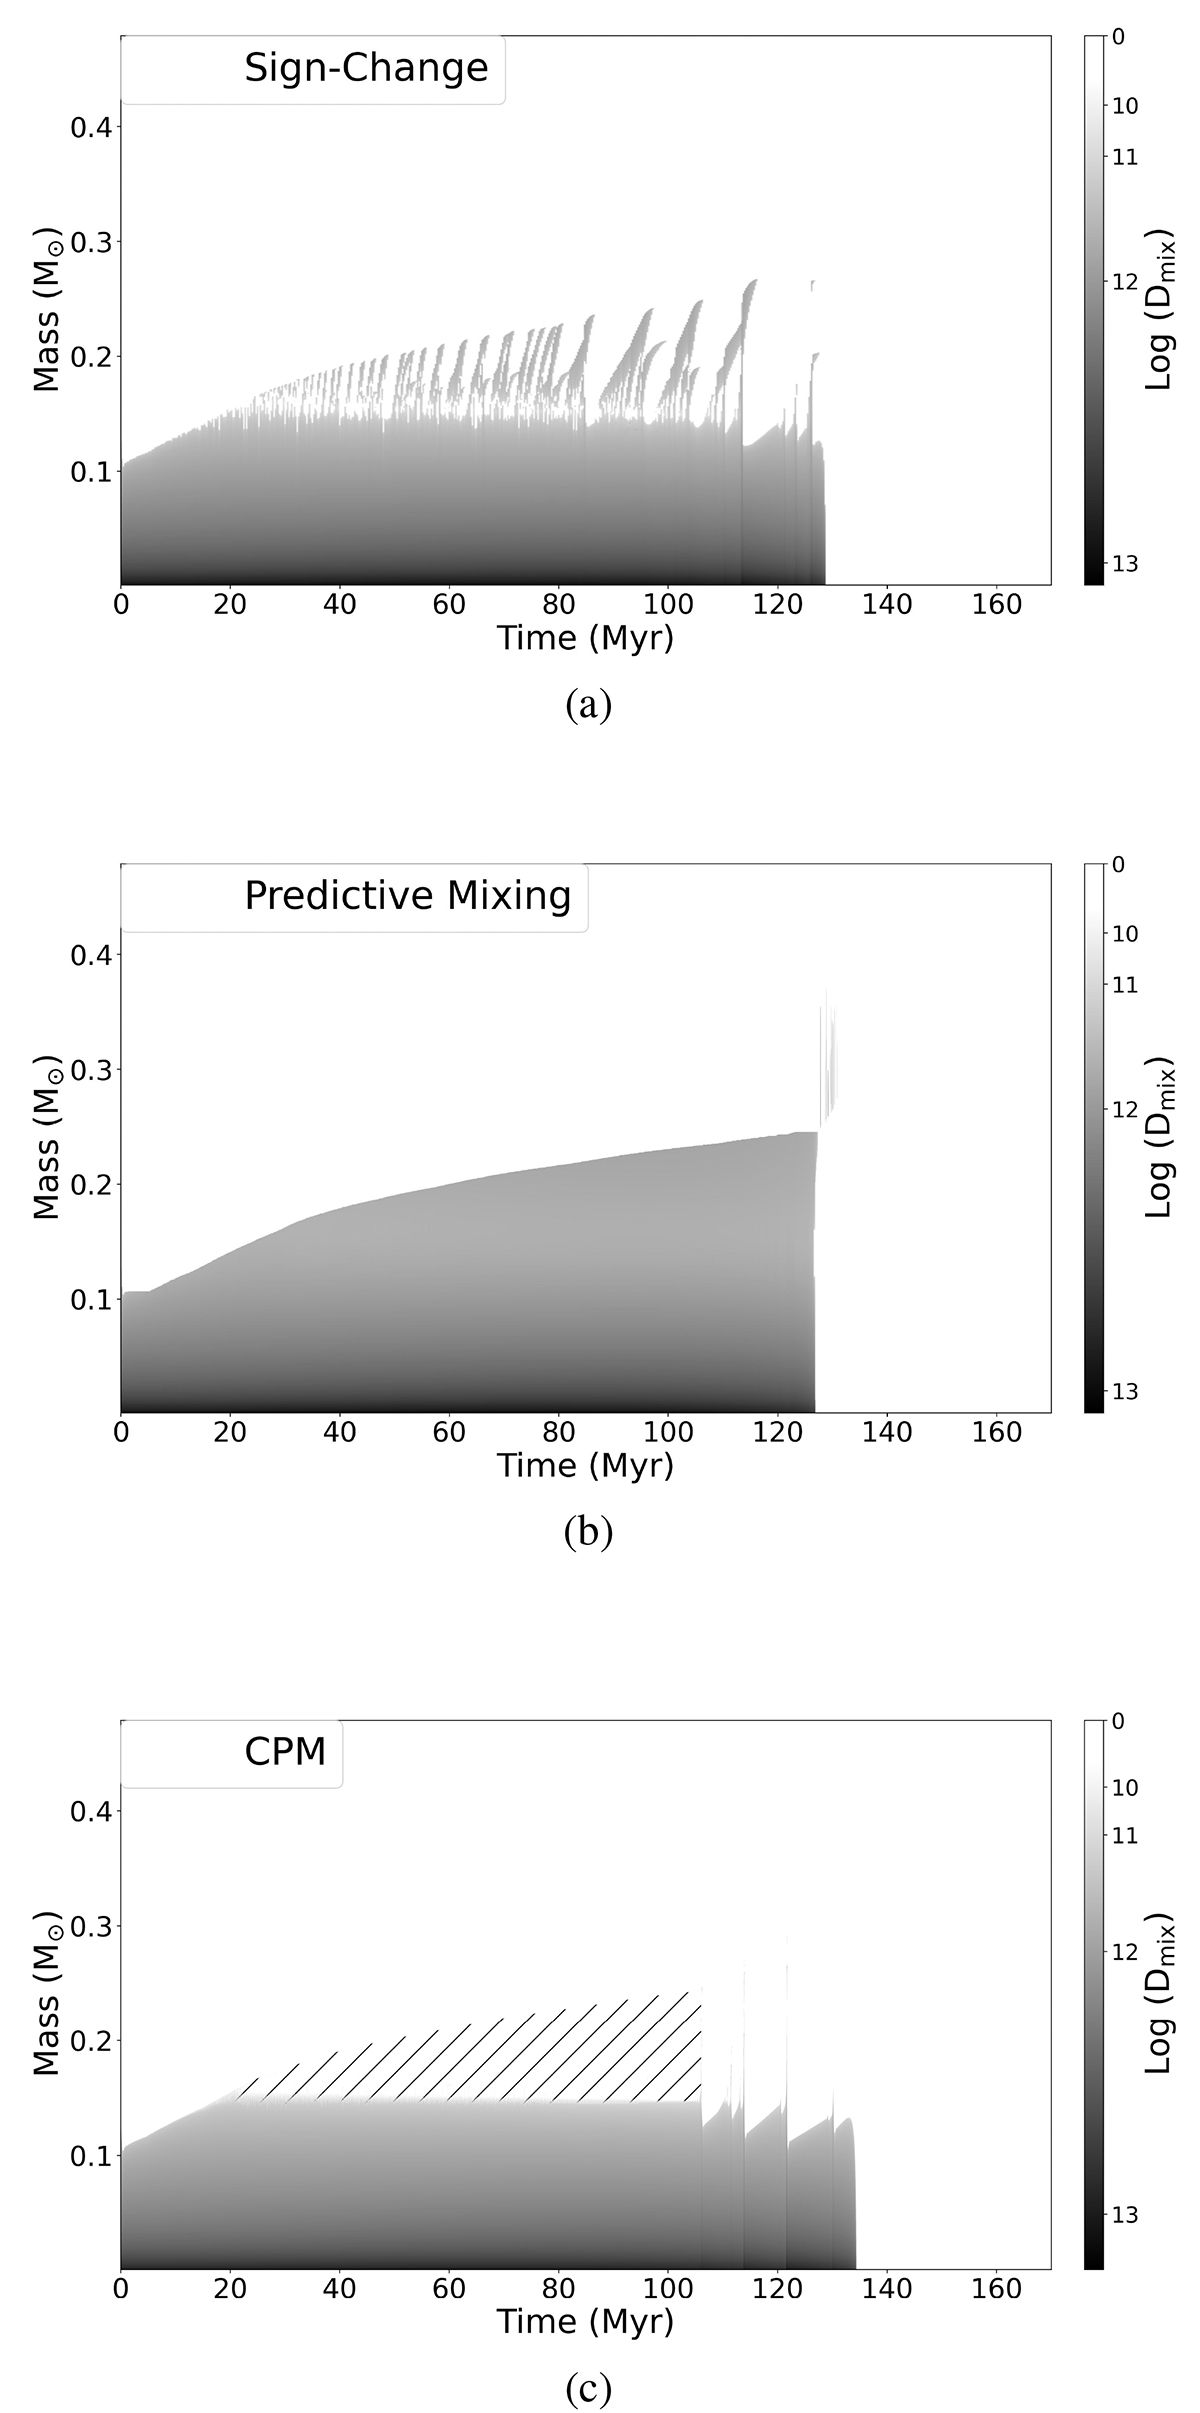
Fig. 1.
Download original image
Schematic representation of the interior structures of an sdB star, displaying the logarithm of the diffusion coefficient for mixing during the core He-burning stage. Different levels of mixing are indicated by the grayscale bar on the right-hand y-axis. The panels show the results of the sign-change numerical method (a), the PM scheme (b), and the CPM scheme (c). Gray denotes convective core regions, with the hatched area in panel (c) indicating semi-convection in the transitional zone between convective and radiative regions.
Current usage metrics show cumulative count of Article Views (full-text article views including HTML views, PDF and ePub downloads, according to the available data) and Abstracts Views on Vision4Press platform.
Data correspond to usage on the plateform after 2015. The current usage metrics is available 48-96 hours after online publication and is updated daily on week days.
Initial download of the metrics may take a while.