Fig. 9.
Download original image
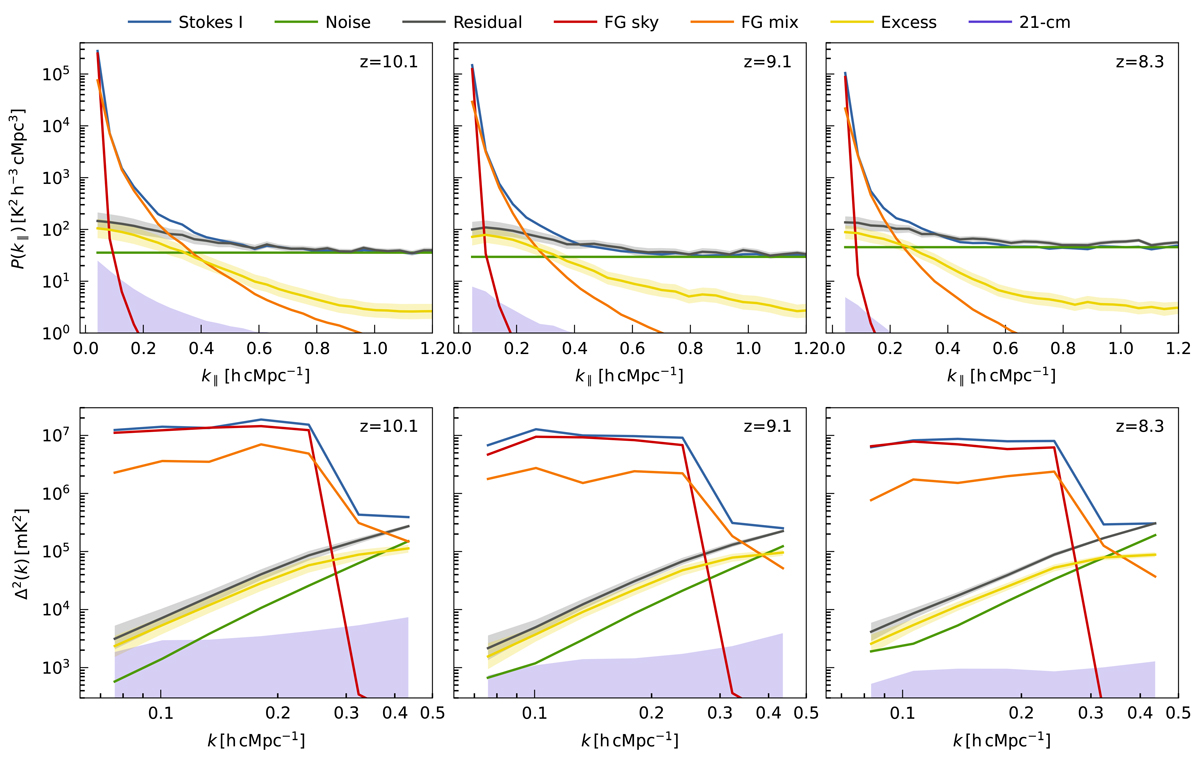
ML-GPR components decomposition of the residual Stokes-I for the three redshift bins. The residual Stokes-I data (blue line) are decomposed into the following components: foreground sky (red), mode-mixing (orange), excess (yellow), noise (green), and the 21 cm signal (magenta). The residual (grey line) represents the Stokes-I data after subtracting all the foreground components. The shaded area represents the 2-σ uncertainty. The top panel displays the cylindrically averaged power spectra as a function of k∥ (averaged over k⊥), while the bottom panels shows the spherically averaged power spectra.
Current usage metrics show cumulative count of Article Views (full-text article views including HTML views, PDF and ePub downloads, according to the available data) and Abstracts Views on Vision4Press platform.
Data correspond to usage on the plateform after 2015. The current usage metrics is available 48-96 hours after online publication and is updated daily on week days.
Initial download of the metrics may take a while.