Fig. 6.
Download original image
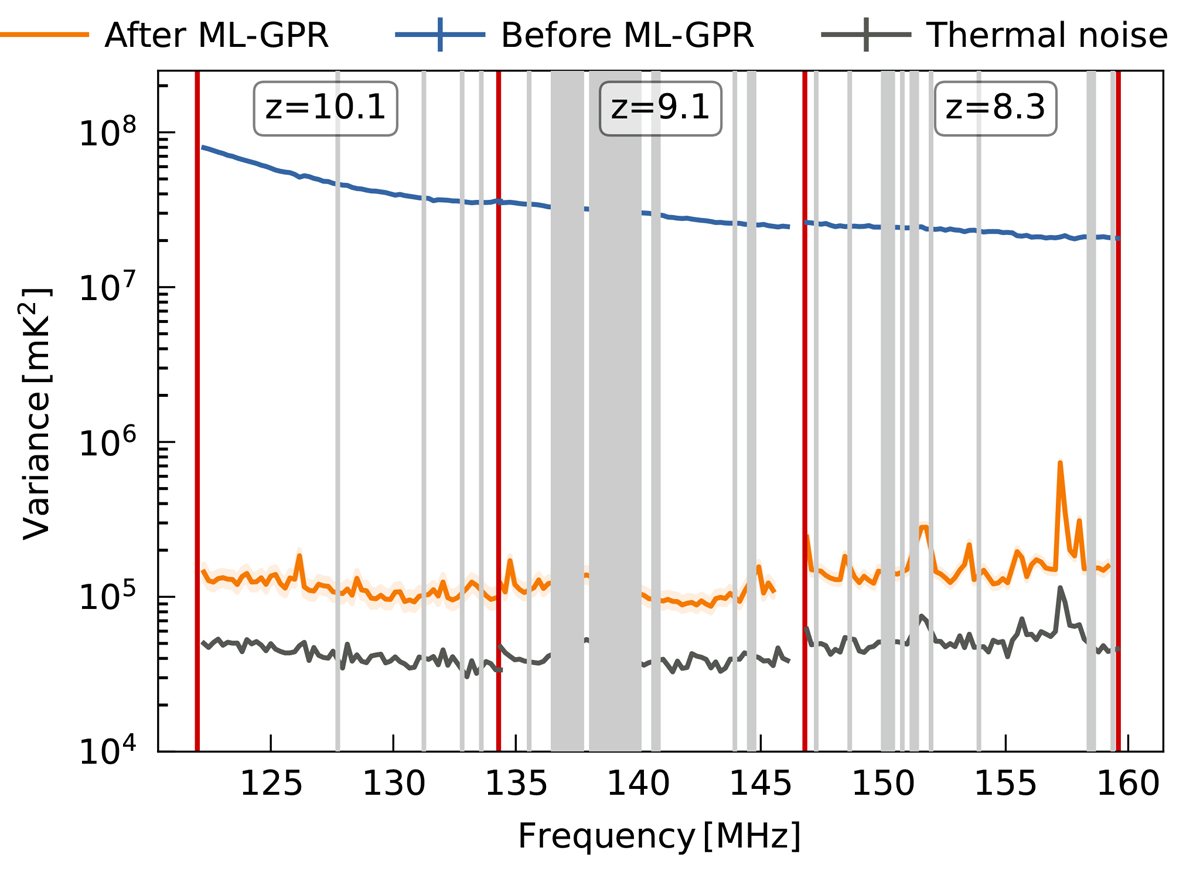
Variance as function of frequency for the ten combined nights of the three redshift bins. The top line (blue) shows the Stokes-I power after sky-model subtraction (DD-calibration). The middle line (orange) shows the variance of the residual after ML-GPR, the bottom line (dark grey) show the thermal noise level estimated from the gridded time-differenced visibilities. Flagged channels are shown in light grey.
Current usage metrics show cumulative count of Article Views (full-text article views including HTML views, PDF and ePub downloads, according to the available data) and Abstracts Views on Vision4Press platform.
Data correspond to usage on the plateform after 2015. The current usage metrics is available 48-96 hours after online publication and is updated daily on week days.
Initial download of the metrics may take a while.